Showing posts with label Paleoseismology. Show all posts

Friday, March 8, 2024

Remembering Thomas C. Hanks

I attended the Tom Hanks, a Remembrance symposium at the USGS in Moffett Field Oct. 17, 2024. It was a great chance to remember Tom, reflect on his vast scientific and personal impacts, and to catch up with old friends and colleagues. It was also nice to meet Tom's daughters. I was fortunate to be able to make a presentation. Here is my talk: LINK.

Here is the program from the event: LINK

~~~~~~~~~~~~~~~~~~~~~~~~~~~~~~~~~~~~~~~~~

I heard that Thomas C. Hanks passed away recently. He was a mentor to me. He worked for his career with the US Geological Survey. The memorials of him from his colleagues will be many and deep. I wanted to capture some of my memories of him. Tom was very supportive of young scientists and very broad in his scientific thinking. While he was most well known as a seismologist, his work in geomorphology and fault scarps and fragile geologic features was transformative.


This was a sticky on a manuscript draft he once gave me after a discussion on uncertainties in morphologic datting. Look at the nice handwriting (usually from a well sharpened #2 pencil). And the signature THanks.

Tom was on my Ph.D. supervisory committee. I was at Stanford and Tom was in Menlo Park at the USGS. Like many of his colleagues there, he was very generous with his time with the Stanford students. We talked a lot about fault scarps and diffusion, but also about the San Andreas Fault and I was able to drive for him on a few field trips to the SAF in the southern Bay Area into the Creeping Section. With Professor Gordon Brown's support (chair of our department at the time), Tom helped to lead an active tectonics seminar one quarter.

Tom's work on the age of scarplike landforms from diffusion-equation analysis (title of one of his latter papers on the subject) was very influential. He teamed up with Robert Wallace and others to take something simple about how fault scarps apparently change shape over time and quantify it in a realistic way. There are numerous important papers on the topic with Tom as an author but two seminal ones are:
Hanks, T. C., Bucknam, R. C., Lajoie, K. R., & Wallace, R. E. (1984). Modification of wave-cut and faulting-controlled landforms. Journal of Geophysical Research. https://doi.org/10.1029/JB089iB07p05771
and
Hanks, T. C. (2000). The Age of Scarplike Landforms From Diffusion-Equation Analysis. https://doi.org/10.1029/rf004p0313 in Quaternary Geochronology: Methods and Applications. In AGU Reference Shelf 4 (Vol. 4).

Among many other contributions on the age of scarplike landforms, Tom introduced a simple morphological dating approach: reduced slope-offset. He argued for a measure of the scarp midpoint slope (reduced by the far field slope) versus the vertical offset and he developed a nice calibration along with his colleagues for the rate constant k. He favored analytical solutions (tolerating my numerical approach).
One small anecdote that I always appreciated on the geomorphology side was his desire to name a unit for GK Gilbert (1m2/kyr = 1GKG). See the seminal 1984 Hanks et al JGR paper. It did not catch on but was a fun idea.

In 2007, David Haddad and I went with Tom to Northern Arizona University to see the collection of his father's photographs that he had endowed: Repeat Photography Site for The James J. Hanks Photographs, 1927-1928. Tom, like always, was deeply engaged/obsessed with the topic at hand. He worked hard to relocate and repeat his father's photographs, as well as to tell their story.

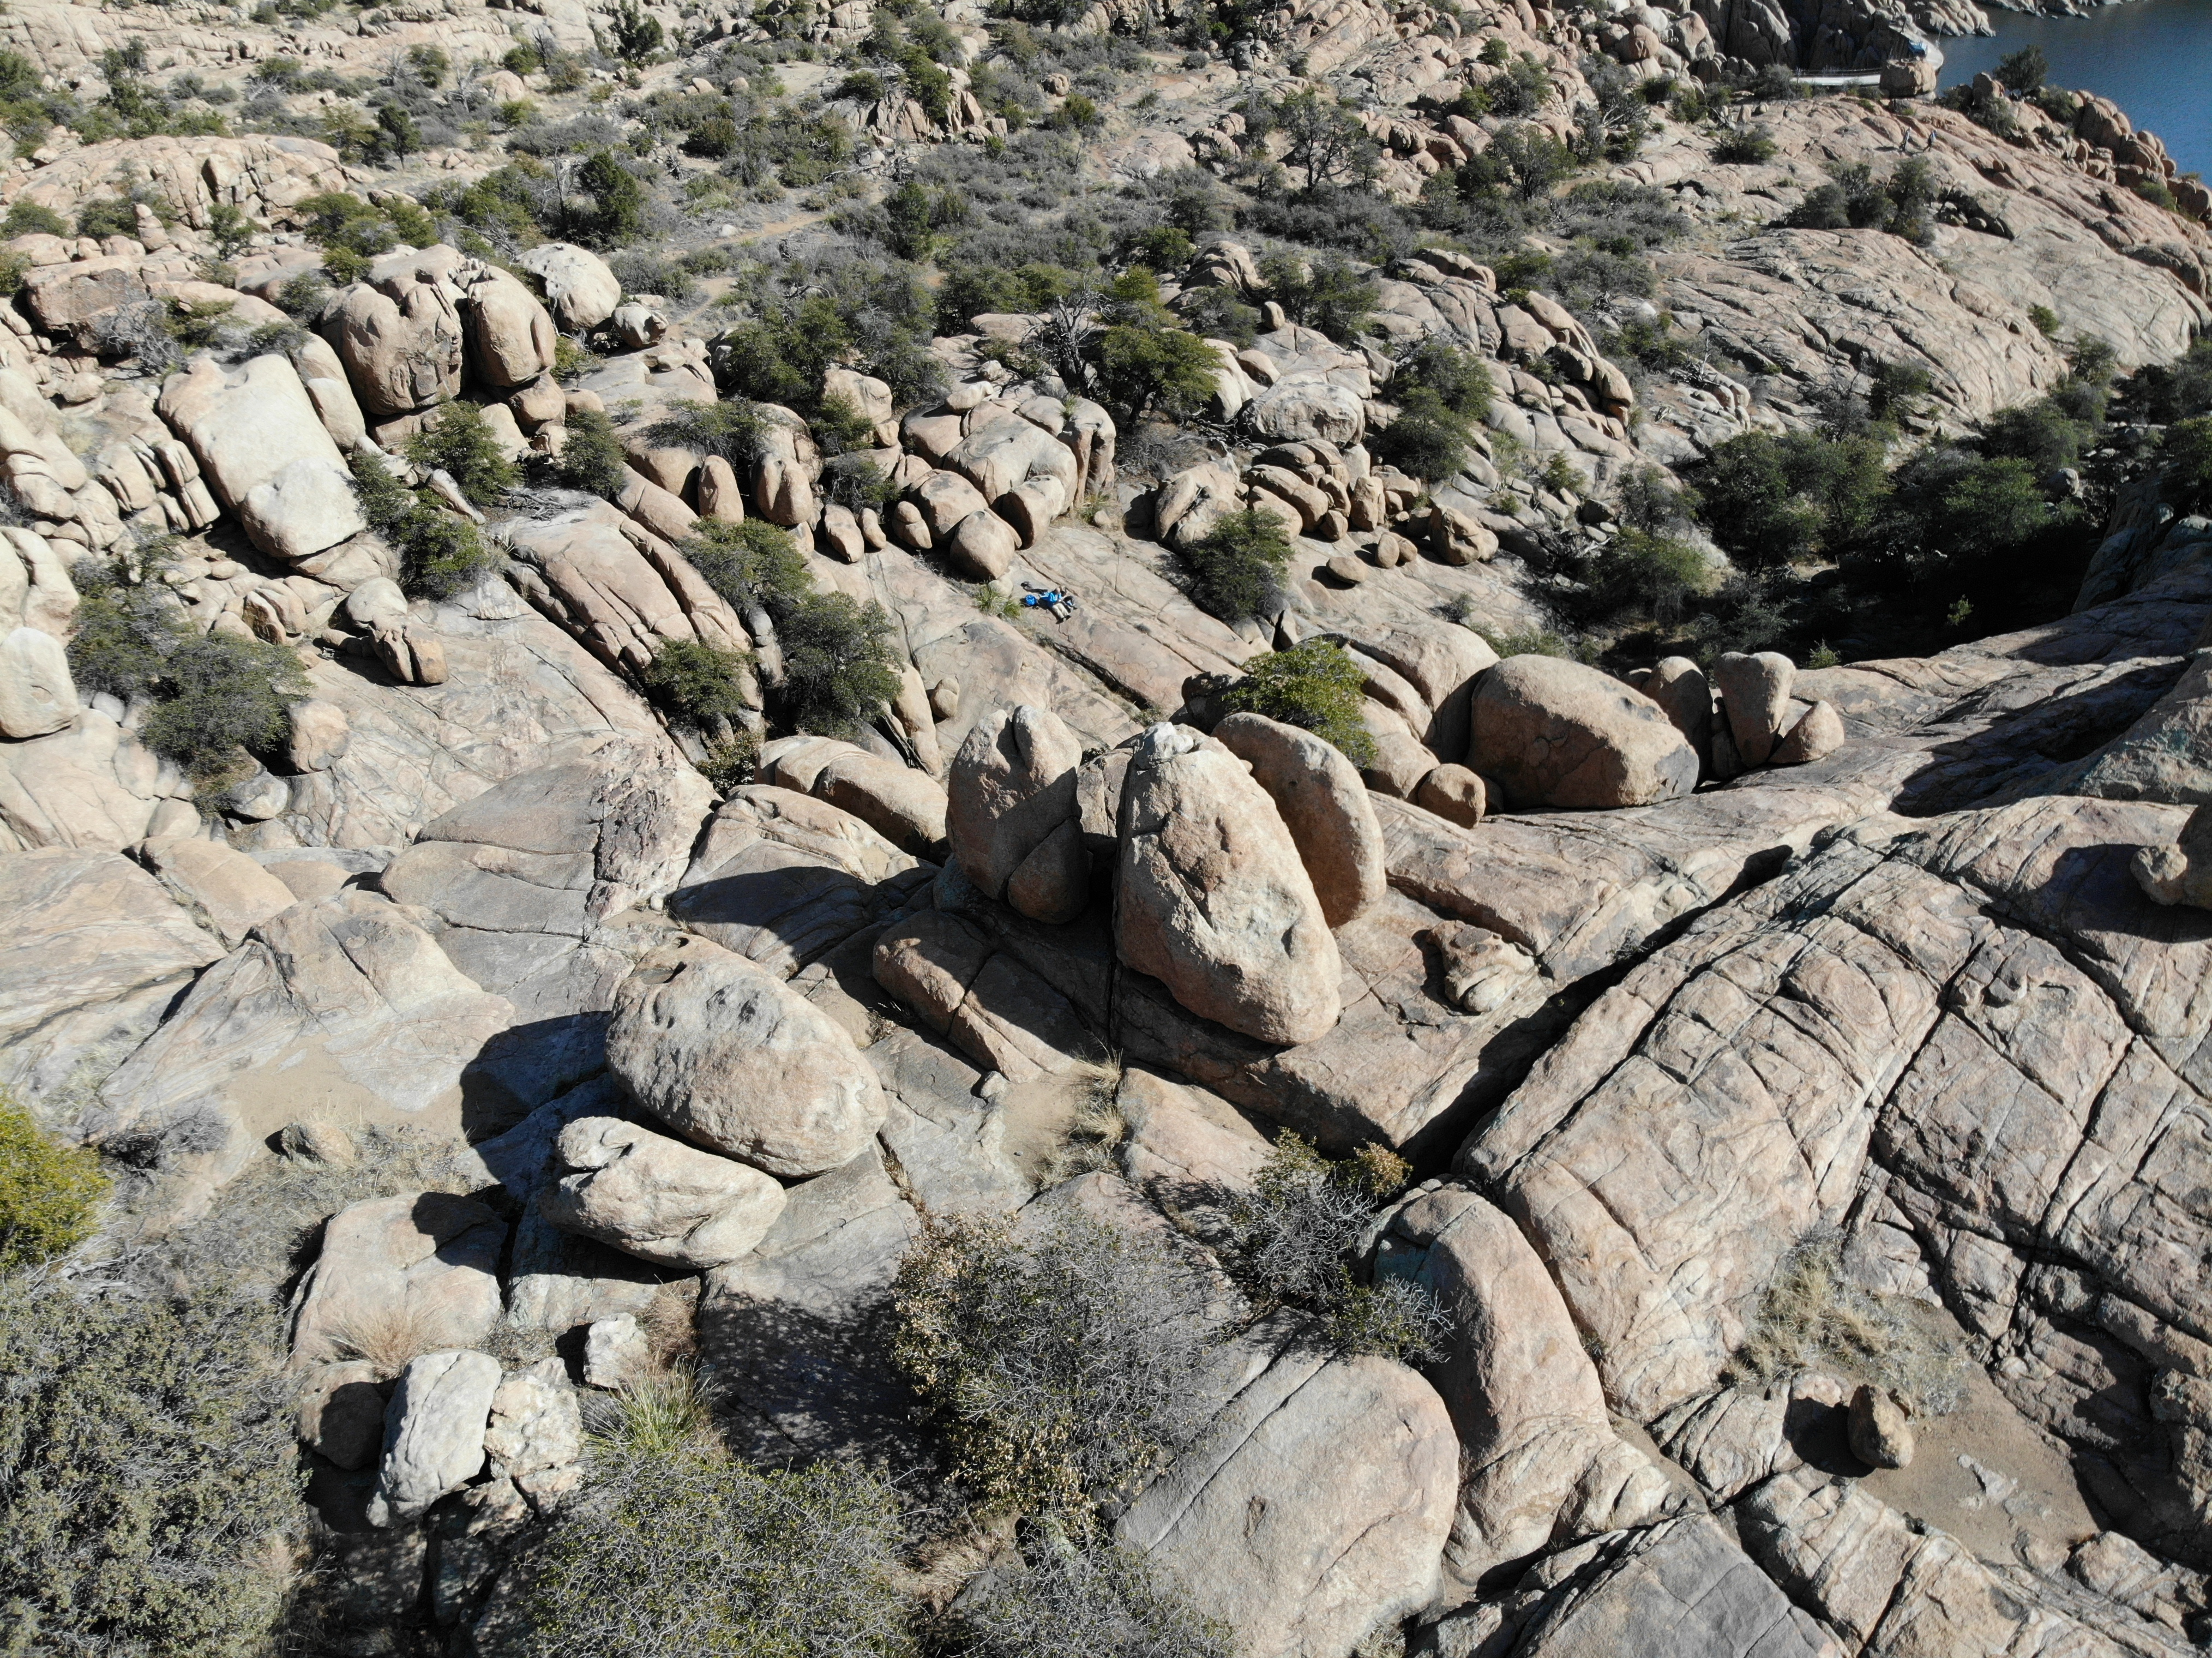
Whilst on the trip to Flagstaff, Tom, David, and I stopped to see and discuss the Granite Dells (near Prescott, AZ). Tom had been leading parts of the seismic hazard analysis for the Yucca Mountain possible nuclear repository. The problem they were coming up with was the age of the landscape was great (million year old landforms) and there were fragile geologic features and precarious rocks that may have been there fragile for a large fraction of that time. However, the extrapolation of the ground motion predictions would be to extreme, possibly unrealistic levels. Tom was interested in these million-year-old landscapes of fragile geologic features and recognized their value as an observational constraint for seismic hazard analysis. This is an impressive product of their work:
Hanks, T. C., Abrahamson, N. A., Baker, J. W., Boore, D. M., Board, M., Brune, J. N., Cornell, C. A., & Whitney, J. W. (2012). Extreme Ground Motions And Yucca Mountain. Extreme Ground Motions and Yucca Mountain Open-File Report 2013–1245, US Geological Survey.

Tom was interested in precariously balanced rocks given their use as a part of seismic hazard analysis. He thought it might be helpful for new people to get involved. So, he pulled David and I into it. He was supportive and helped generate some funds for us. That lead to a couple of nice papers lead by David. I regret that we did not have Tom as a coauthor:
Haddad, D. E., Akciz, S. O., Arrowsmith, J. R., Rhodes, D. D., Oldow, J. S., Zielke, O., Toke, N. A., Haddad, A. G., Mauer, J., & Shilpakar, P. (2012). Applications of airborne and terrestrial laser scanning to paleoseismology. Geosphere, 8(4). https://doi.org/10.1130/GES00701.1
Haddad, D. E., Zielke, O., Arrowsmith, J. R., Purvance, M. D., Haddad, A. G., & Landgraf, A. (2012). Estimating two-dimensional static stabilities and geomorphic settings of precariously balanced rocks from unconstrained digital photographs. Geosphere, 8(5). https://doi.org/10.1130/GES00788.1

A final lesson from Tom is that senior scientists should be generous and use their privilege to do good. Tom was a widely appreciated mentor of younger scientists--men and women. He was also a leader who did not shy away from trying to do the right thing. Just one example relates to another senior scientist who recently passed away: Paul Tapponier. Professor Tapponier led a transformation of our understanding of continental tectonics. He favored results with relatively high slip rates and thus the inference that the deformation even in plate interiors was more plate-like. Tom supported his colleague Wayne Thatcher who had come up with a result based on geodesy for the deformation of the Asian continental interior (Thatcher W. 2007. Microplate model for the present-day deformation of Tibet. J. Geophys. Res. 112:B01401) (and that did not sit well with Paul). Zack Washburn and I had written a paper based on paleoseismology in which we could not support enough earthquakes to support a high slip rate). Tom stepped in to mediate between Wayne and Paul and consulted me as part of his preparations. Tom had the stature, the intelligence, maturity and deserved respect so that he was able to set the tone for what I gather was a productive meeting.

I ended up with a copy of Tom's USGS bio and I note the following which is a nice example of his writing and matter-of-fact approach:

Thursday, June 30, 2022

A simple evolutionary model for fragile geologic features

The fragility of geologic features, such as precariously balanced rocks (PBRs), can be measured by a simple parameter like α. For the case of a PBR is the smallest of the angles between the vertical from the center of mass and its rocking points. In a landscape, each object will have a fragility and so the ensemble will be a fragility distribution. The controls on the initial distribution and its long term evolution will be from the environment and its history (material properties, landscape evolution (lowering), weathering, shaking, etc.). The distribution can be disturbed by an earthquake (or other loading like windstorm, human impacts, etc.) which abruptly removes features with fragility below a threshold α.

Example of PBRs in Granite Dells, Arizona

I started to think an analogy with a fruit tree. I am not sure this is an original idea maybe I heard it somewhere. The progressive ripening of the fruit can be interrupted by a shake which will remove completely a subset of the most ripe fruit. For the case of the rocks, the ripening is a gradual decrease in fragility over time and then a fragility reset of a subset rather than removal after they are toppled in a shaking event. Ripening continues and the processes repeat over time. This simple model does not account for changing ripening rates or much variation in shaking effects other than threshold α. The basic idea then for seismic hazard is that the fragility distribution at a location reflects the history of the long term ripening and episodic shaking and reset. Therefore, if we can produce fragility distributions for landscapes that otherwise comparible (ripening and threshold α), we might be able to say which has seen more recent shaking and of what severity. This does not directly address the age control for the history and this remains a significant problem.

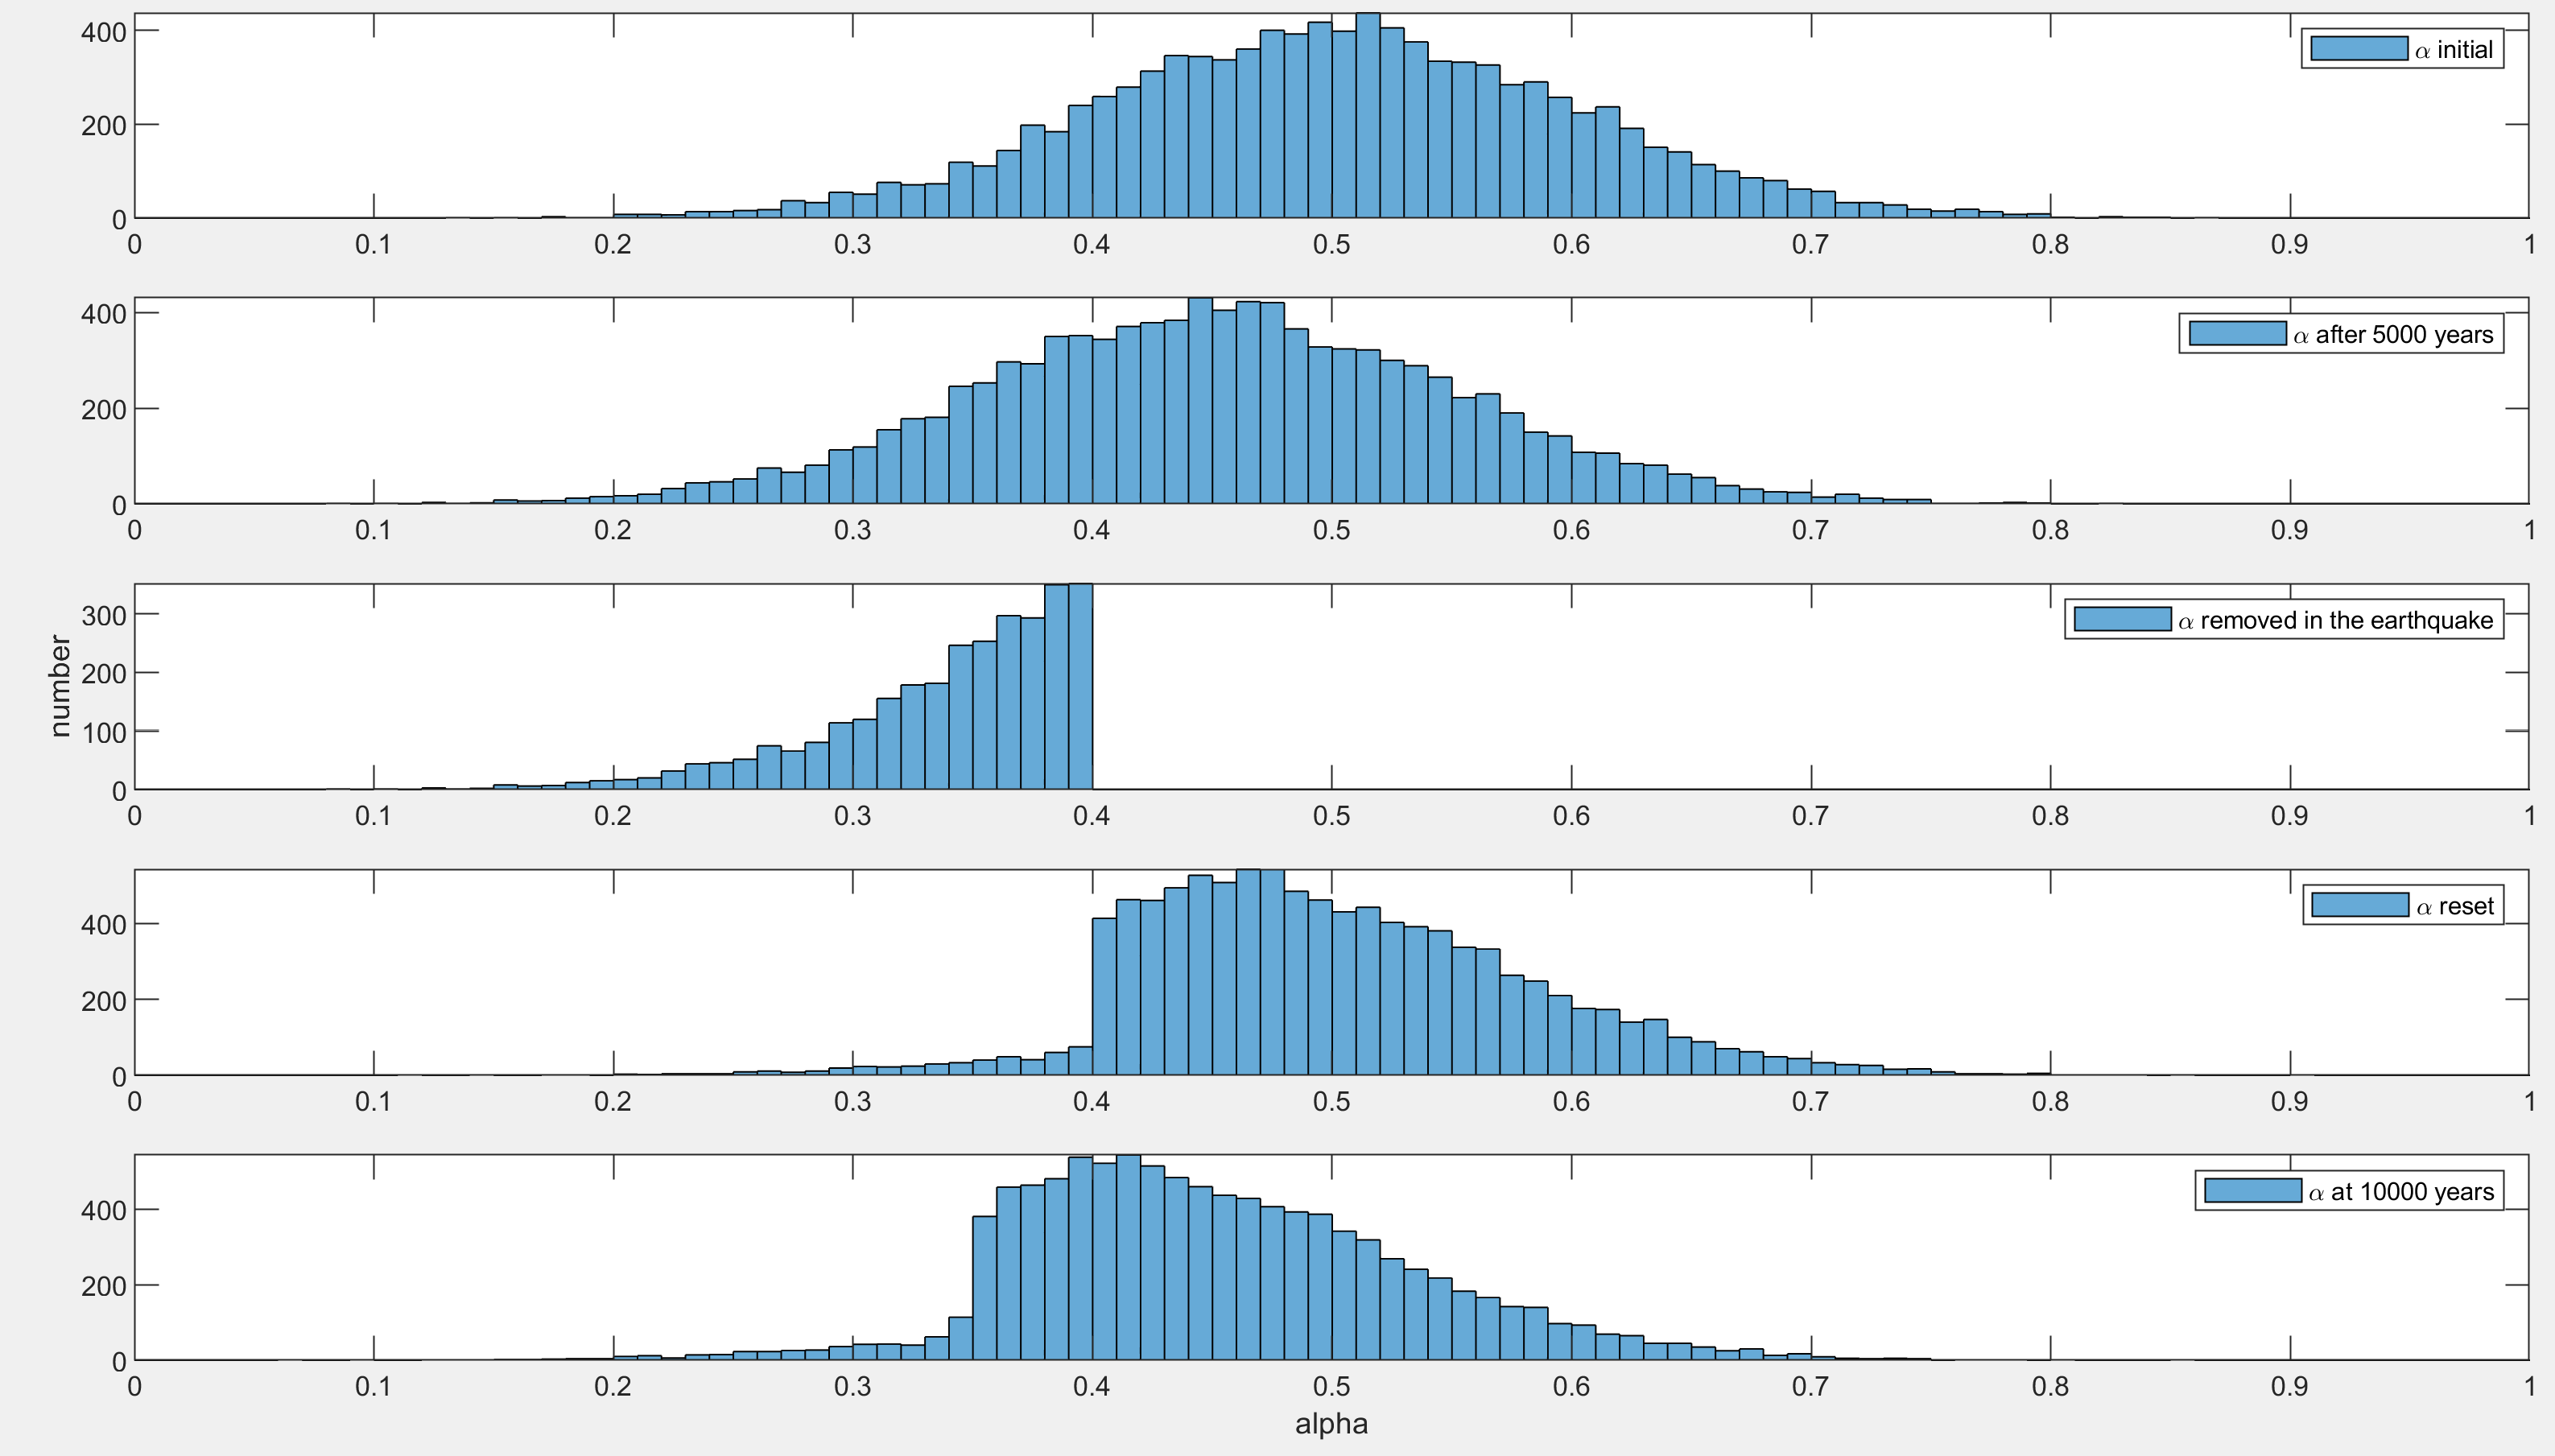
I wrote a simple code to explore this problem with the hope that it helps us explain and isolate the basic controls on fragility distributions. See the figure below which presents the fragility distributions through the experiment.The algorithm is simple:

  • Set up: Specify number of objects, the initial α distribution (assume normal), the ripening rate distribution (also normal; this is the loss of fragility per year), the timing of the earthquake, the threshold α, and the max time
  • Interseismic period 1: ripen α until the earthquake (begin and end are the upper two plots below)
  • Earthquake: remove α < threshold α (third plot below) and reset those α drawing from the same initial distribution (fourth plot below)
  • Interseismic period 2: ripen α until the end of the model time (final plot below)

Fragility distributions through the experiment. Upper plot is initial α. 2nd plot is α and the end of interseismic period 1. 3rd plot shows removed objects with α < threshold α. 4th plot is reset distribution of < threshold α Note that some α results below threshold α. Lowest plot shows continued ripening until the end of the model.

The additional two figures show the evolution of fragility with time of a subset of the objects and a spatial view of the randomly positioned features, their fragility at the time of the earthquake, and the circled objects that failed. The evolutionary diagram helps illustrate the interruption of the more fragile features by the event while the others do not notice. The map provides an idea of the search challenge that this scenario presents.

Evolution of fragility of a subset of the objects. The red star indicates the time of the earthquake and the threshold α.
Map view randomly positioned features, their fragility at the time of the earthquake, and the circled objects that failed.
Maybe more realistic with a more sparse set of features and a lower threshold α (0.3 as opposed to 0.4 above).

This is just a sketch of the problem, but it is a toy model in which we can explore the importance of the distribution widths, timing of earthquake, etc.

The MATLAB code is in this repository: https://github.com/jrarrowsmith/MATLAB-Geomorphology; make sure to get the script PBRevolution.m and functions ripenPBR.m and shakePBRs.

Monday, December 16, 2019

Call for research papers: Unveiling Active Faults: Multiscale Perspectives and Alternative Approaches Addressing the Seismic Hazard Challenge

Along with Federica Ferrarini, Nathan Toké, and Michele M. C. Carafa, we are looking forward to submissions to this special "issue" from the Frontiers journal: Unveiling Active Faults: Multiscale Perspectives and Alternative Approaches Addressing the Seismic Hazard Challenge.

Federica made a nice flyer to share: LINK


Central Apennine settled landscape with active normal fault (photograph by Federica Ferrarini).

Despite decades of progress toward mitigating seismic hazard, characterizing the seismic potential of an area remains a complex process. Particularly challenging are seismically active regions characterized by low slip rate faults which can give rise to weak geomorphic expressions when combined with high erosion or sedimentation rates. Similar compounding issues may also manifest in densely populated areas where anthropogenic modifications, or vegetation cover further challenge assessment of fault activity or where structural complications may contribute to multiple interpretations. Noticeable advances in remote sensing technology geodetic measurements and dating Late Quaternary landforms and sediments have moved our understanding forward.

This Frontiers Research Topic welcomes contributions that present examples and approaches which strive to improve our understanding of active faulting processes over diverse geological settings and at broad spatial scales of investigation. We encourage the submission of research papers from a wide range of geoscience disciplines (field geology, structural geology, tectonic geomorphology, paleoseismology, seismology, remote sensing, numerical modeling) and from the scale of a field site to regional scale analyses. We welcome contributions with the main goal to bridge the gap between our observations, fundamental understanding of faulting processes, and effective seismic hazard assessment.

Please think about a contribution! Submit an abstract by January 29, 2020 (not required). The manuscripts are due May 29, 2020.

Monday, March 11, 2019

Anniversary of Great Tohoku Japan earthquake and tsunami (20110311)

Today is the anniversary of the catastrophic great Tohoku Japan earthquake and tsunami of March 11, 2011. While I am not an expert of subduction systems nor tsunamigenesis, I was of course interested in the event and prepared some lectures about it. While there are many better and newer illustrations, I wanted to share the materials.

The first presentation was at the Arizona Science Center in 2011. Here is the folder of the materials.

I prepared a lot of content for a series of lectures at IT Bandung in Java that I presented in 2013 with the help of my former student Dr. Gayatri Marliyani. There is much high quality material at IRIS (some of which I have included). The main materials are in these three folders:

Monday, February 25, 2019

Updated review of fault scarp analysis

I am organizing for a presentation to my research group on fault scarp analysis. This is an ongoing obsession of mine. I have blogged about this topic here with some review. That is still a pretty good summary of things. I also have a couple of relevant Landers Earthquake posts here and here. And, we applied many of the relevant tools to analysis of cinder cone forms.

The 2017 post mentioned above is still a pretty good summary of things. However, the MATLAB-based guis for Penck1D and Scarpdater are not running well now on newer versions of MATLAB; they need an overhaul. We were really into guis back then but they require so much code relative to the actual modeling. Might be cool to rewrite in Jupyter notebooks, maybe see how much in landlab could be used.

I have prepared a new review powerpoint (PPT and PDF) with this outline:

  • Introduction and review
  • Diffusion-equation analysis of scarplike landforms
  • Observations
    • Direct dating of fault scarps
    • Fault scarp erosion monitoring
  • Modeling
    • Distributed deformation
    • Transport vs. Production limited
  • Extending processes 2D and nonlinear diffusion
  • Prospects and cautions
Of course it is incomplete and emphasizes the work of my students and colleagues. I note for example, this nice review from Wei, et al., Journal of Asian Earth Sciences, 2015:

Additional resources for my lecture include:

Some other useful web links include:

Monday, May 22, 2017

One dimensional morphological modeling of transport and production- limited fault scarps

Over the years, I have maintained a steady obsession with fault scarps. For my Ph.D., I worked on a few aspects of fault-scarp development: Arrowsmith, J R., Pollard, D. D., and Rhodes, D. D., Hillslope development in areas of active tectonics, Journal of Geophysical Research, 101, B3, 6,255--6,275, 1996. Correction: Journal of Geophysical Research, 104, B1, 805, 1999. Since then, I have kept the work going along, mostly with teaching applications. In this blog post, I wanted to share some of the presentations and tools that are available to explore, learn about, perform one dimensional morphological modeling of transport and production-limited fault scarps.

A few definitions:

  • One dimensional--means elevation (H) as a function of distance along a profile (x).
  • Transport-limited--there is enough transportable material available for any erosion that comes from the application of the mass continuity equation. In this case, the transport capacity is equal to the sediment supply.
  • Production-limited--there is insufficient transportable material (regolith=material between topographic surface and top of bedrock) for erosion. In this case, the transport capacity exceeds the sediment supply locally.
  • Diffusion erosion--transport capacity is scaled by local slope and a constant k. The consequence of this transport rate choice and the application of continuity for transport-limited conditions yields a diffusion-like or heat-conduction-like behavior.

This presentation (PPT and PDF) provides a bit of a review of fault scarp research as I saw it mostly about 5-10 years ago. This PPT has two embedded movies which illustrate this basic behavior: PPT. Transport-limited scarp movie; Production-limited scarp movie

Transport-limited models:

This web page from my Computers in Earth and Space Exploration class lays out the main derivation and numerical implementation: Lecture 8: Exploring diffusion using Excel. This older page has some Matlab and Excel implementations of 1D transport-limited linear diffusion: Scarp diffusion exercise. Finally, here is a 2D version of transport-limited non-linear diffusion in a paper by Mattia de Michieli Vitturi and me: de Michieli Vitturi, M. and Arrowsmith, J R., Two dimensional nonlinear diffusive numerical simulation of geomorphic modifications to cinder cones, Earth Surface Processes and Landforms, doi:10.1002/esp.3423, 2013.

Production-limited models:

George Hilley significantly updated my original code and produced the Penck1D imlpementation in MATLAB: zip file. Here is an older version of the MATLAB (no gui): zip file.
The software is delicate in some ways so you may have to try it a few times! If it crashes, just start over. One important thing is that it works best if downhill is to the right.

Note in particular the user's manual we wrote in 2006: Hilley, G. E., and Arrowsmith, J R., Penck1d: Transport- and production-limited fault scarp simulation software, user's manual for software used at 2001 Geological Society of America Short-course: Tectonics and Topography: Crustal Deformation, Surficial Processes, and Landforms Cosponsored by GSA Structural Geology and Tectonics Division and taught by Dorothy Merritts and Roland Bürgmann.

Wednesday, October 5, 2016

Goodbye to SoSAFE (Southern San Andreas Fault Evaluation): review and a recent workshop

The SoSAFE activity was a very successful data gathering and interdisciplinary science rallying activity in the Southern California Earthquake Center (SCEC) for 10 years. Its early leader was Dr. Ken Hudnut from the USGS. The original aspiration was to develop understanding of the last 2000 years of activity along the Southern San Andreas Fault. I was fortunate to be invited to help co lead SoSAFE in 2011. Dr. Kate Scharer (USGS) was the other co-leader. Her recent research has been largely focused on understanding the southern San Andreas Fault paleoseismic history. I very much appreciated the chance to work with Kate to help coordinate the research activity of SoSAFE withing SCEC as part of its Planning Committee. Our main efforts included evaluating proposals and helping coordinate and promote the research of our colleagues. We did a few additional activities including the "FieldShop" in which we made a group field trip to discuss and assess small offset landforms along the San Andreas Fault Mojave segment near Pearblossom. The outcome of the FieldShop was a paper lead by Kate: Scharer, K. M., Salisbury, J. B., Arrowsmith, J R., Rockwell, T. K., Southern San Andreas Fault Evaluation field activity: Approaches to measuring small geomorphic offsets and challenges and recommendations for active fault studies, Seismological Research Letters, v. 85, no. 1, ppl 68 - 76, 2014. In addition, we also organized (along with Prof. Mike Oskin from UC Davis) the SoSAFE and Earthquake Geology Geochronology workshop in 2014. The discussions of novel applications of geochronology for earthquake geology were really interesting and helpful for the community. SoSAFE has been sunsetted as an activity within SCEC as it moves into its 5th iteration (SCEC5). Much of the important work of SoSAFE will be subsumed (and hopefully continued) in the San Andreas Fault System Working Group to be led by Kate and Prof. Michele Cooke (UMass). It makes some sense I suppose as a refresh on SCEC structure, but I and others are concerned about the loss of emphasis on paleoseismic data gathering.

Nice cover image produced by Barrett Salisbury (ASU).

In our last SoSAFE activity, Kate and I organized a workshop for Sept. 10, 2016: SCEC SoSAFE Workshop: Recent Successes and Future Challenges. The workshop had 3 main themes:

  1. Earthquake recurrence and slip over short and long term: how does it all add up?
  2. Integrating earthquake and paleoclimate/paleoenvironmental chronologies on the SoSAFE System
  3. Outside looking in: Broad applications of Behavior of high slip rate faults
The workshop was well attended (we capped it at 40 people, but many more wanted to join).

Several synthesis points were evident from the presentations and discussions:

  • The opportunity to and importance of documenting the full spectrum of slip behavior at a range of slip speeds (creep to seismic) and both on and off fault. Where in space and time along and adjacent to the fault surface is there deformation, and how might the behavior vary over time? How to capture the integrated effect of fine scale fracturing? (Toké, Milliner, Lindsey)
  • Variable slip at a point in successive earthquakes is suggested by detailed evidence from many sites. In some paleoseismic records, we may be seeing both small and large events mixed in the same record. This is a good picture of the earthquake phenomena but a greater challenge for interpretation. (Dawson, Salisbury, Rockwell, Biasi)
  • Paleoseismic event recognition and resolveability. Are we under or over counting paleo earthquakes? The consensus among the group (and as analyzed by Biasi) was that both happen and so suggestions of systematic overcounting (e.g., D. Jackson) were not supported by experience. But, there certainly is value in exploring ways to systematize paleoseismic data (evidence, age control, correlation, etc.). (Dawson, Rockwell, Biasi, Milner). Tim Dawson reminded us of the important work of Bonilla and Lienkamper, 1991. The time scale during which many of the comparisons are being made (~1000 yrs) may be too short to completely assess the question of moment rate fluctuation across the SoSAFE system.
  • Slip rates vary in space and time probably as a function of evolving fault geometry (at multiple length scales) and mechanical interaction (Cooke, Onderdonk).
  • Interpreting offset per event from the reconstruction of fine scale landforms remains challenging. 3D excavation and reconstruction is desired but time consuming (and itself can have subtleties and ambiguities). There is a "... tension between collection of observations at as many locations as possible (assuming there will be signal in the noise [Large N]) versus inclusion of only data that are clearly offsets (rather than deflections) and have good quality ranking." (Scharer, et al. 2014). Interpretation of small geomorphic offsets will not go away given its convenience, the availability of high resolution imagery and topography, and the potential to assess remote structures. But, we must continue to validate and push to understand what we are measuring, entertain alternatives, identify 3D anchor sites, etc. (Salisbury)
  • Earthquake simulators are moving forward as the preferred integrative tool for forecasting earthquake behavior across the SAF system ("Paleoearthquake data and slip rates battle it out in UCERF3--RSQSIM to the rescue"--Kevin Milner, USC). Jaqui Gilchrist (USC) gave a nice presentation reviewing the simulator approach. Her faults are quite smooth from the perspective of the many geologists in the room. Importantly, we learned about the tuning that is done by adjusting fault normal stresses to match paleoearthquake rates across the system. She showed that there is a gap between the curated paleoearthquake datasets she has used and the data producers. There is a need for deeper access to paleoearthquake data and metadata. SCEC-VDO was rebuilt in 2016 and is a valuable tool for visualization and exploration.
  • Field earthquake geology is time and resource consuming. Assuming that the site conditions are good enough to preserve a high quality record, it is important to recognize that it takes at lot to produce high quality field studies, both in the field, as well as in the geochronology laboratory.
The early afternoon featured thought provoking talks about paleoclimate and paleoenvironmental chronologies. Here are a few of my takeaways:
  • Kate showed in her 2014 paper (Scharer, K. et al., 2014b. Paleoearthquakes at Frazier Mountain, California delimit extent and frequency of past San Andreas Fault ruptures along 1857 trace. Geophysical Research Letters, 41(13), pp.4527– 4534.) how using paleosol and sediment accumulation curves would illuminate similarly timed landscape variation in California. She demonstrated that it was likely that earthquakes with overlapping ages at separate paleoseismic sites were different because their evidence was above and below a period of slow sediment accumulation (a paleosol). This is quite exciting and a frontier for earthquake geology. The challenge is what is the best proxy? Paleoprecipitation indicators? or Pollen or fire? How to balance convenience and the ability to measure with environmental sensitivy and ability to date?
  • Prof. Matt Kirby (CSU Fullerton) presented a nice review of paleoclimate and paleoenvironmental proxies (temperature, precipitation, circulation, flooding, fire, other geomorphic disturbance). He focused on the rare lake records of southern California and differentiated millenial, centennial, sub-centenial to decadal, and annual time scales and their different drivers (mostly interactions with the Pacific Ocean). The millenial scale offers an opportunity to look at (synchronous formation of large markers along the SoSAFE System--e.g., Wallace Creek at 3,700 years BP and other similarly aged offset landforms). The sub-centennial to decadal (or finer scales) offer the opportunity for further differentiation of paleoearthquakes (e.g., Scharer, et al., 2014b) as well as the formation of small scale markers for single or few event offsets.
  • Matt called out the need for common protocols, the value of looking at sections together, and that there were lots of interesting possible sites out there. We can use existing sites as benchmarks and prospect for new ones. This work costs $$!
  • Prof. Nick McKay (NAU) offered valuable perspective as well as a potential path forward for organizing paleoseismic and paleoclimate data. He talked about the PAGES2K effort as a distributed global collaboration on past climate. It relies on a cyberinfrastructure of linked paleodata (McKay, N., and Emile-Geay, J., 2015, Technical Note: The linked paleo data framework – a common tongue for paleoclimatology, Climate of the Past, 11, 4309-4327.). He ended with some commentary on the challenges of supporting such a data effort (1) Identify metadata, 2) Structure metadata hierachically, 3) Be thoughtful about Selection Criteria, 4) Iterative data and metadata assimilation, and 5) Flexible scientific control).

Many thanks to our colleagues for their great ideas and community spirit in support of SoSAFE. Adieu!!

Sunday, June 28, 2015

Anniversary of 1992 Landers California earthquake

The Mw7.3 Landers, California earthquake occurred on June 28, 1992 (USGS page). It is known for a number of interesting features including significant foreshocks and a complex multifault rupture. I was very much interested the surface rupture pattern and had the good fortune of responding quickly to the event with Dallas Rhodes as well as my fellow graduate students. To be there right after the event (in the rather hot summer Mojave Desert) was very exciting. We worked along the Emerson Fault (northern portion of the rupture).

Many colleagues studied the event and lots of cool and important papers were written. I won't summarize all here. I will link to a few and mostly emphasize our geomorphic studies of the rupture along the Emerson Fault.

The main summary paper put together shortly after the event is Sieh, et al., 1993. A structural interpretation of the Emerson Fault deformation is in Aydin and Du, 1995. The McGill and Rubin, JGR, 1999 paper is really cool with some pretty mapping, data synthesis and some cautions about interpreting single event offset data among other things. Here is a video panning along their rupture map:

Here is the mp4 of that video.

Our detailed fracture mapping has not been published in detail. I summarize some of what we did logistically in this document about surveying (scroll to the end). Here is a compilation of the mapping (click to see bigger):

Dallas Rhodes and I were really interested in the potential to study the original forms and initial and ongoing modifications to the remarkable scarp that formed along the Emerson Fault. We set up a survey network and took many pictures along the rupture. We have revisited the site many times over the years to resurvey, describe, and photograph. A description of the initial changes was the first chapter of my dissertation and my first published paper as first author: Arrowsmith and Rhodes, Bulletin of Seismological Society of America, 1992. Here is a link to a series of annotated photographs in which I wondered if there were multiple senses of motion along the fault surface. Here are some kite photos of the site in 1998. In 2008, we laserscanned the site. Those data are also among the Terrestrial Laser Scanner data on OpenTopography. And, in 2012, we flew some cameras from a balloon over the site and were able to produce some nice 3D models:

Here is the mp4 of that video. This blog post has some more. And, the Johnson, et al., 2014 paper does a nice job of comparing Structure from Motion data (2012) and the 2008 TLS.

I put together a powerpoint on some of the fault scarp work on the Emerson Fault here (video link to lecture) as part of a series of active tectonics lectures. The Haddad et al. 2012 Geosphere paper presents some of the updated work at the site. More to do!

Saturday, November 15, 2014

SoSAFE and Earthquake Geology Geochronology workshop report (Southern California Earthquake Center)

Kate Scharer (USGS), Mike Oskin (UC Davis) and I organized a geochronology workshop for the Southern California Earthquake Center community this fall. We emphasized methodologies useful for investigating fault slip behavior over time scales from 102 to 106 years. That included Terrestrial Cosmogenic Nuclides, Uranium Series, and Optically Stimulated Luminescence. We did not talk so much about 14C given its relative maturity, but we certainly recognize its continued value.

Kate lead the charge on the completion of the workshop report. It has a nice summary of the topics covered (here is the original agenda). I had a sense of a real acceleration in the number and quality of applications of the methods and the resulting rich depiction of deformation rates and their variations across time and space in Southern California. I was particularly moved by the climate modulation on the development of landforms (alluvial fans, channels, etc.) that serve as markers as well as the possible temporal coherence of wet and dry times across the region. I think that this modulation and coherence can be exploited with more intensive application of geochronology.

I learned a lot more geochronology, especially having just been at the EarthScope Geochronology Institute a week or so earlier--note that the talks and some of the videos are up (where we covered some similar topics and where Kate was a speaker on 14C). It was very nice to see many SCEC friends and colleagues.

Tuesday, November 11, 2014

Fall 2014: PATA-Days in Busan, Korea

I had a wonderful trip to Busan, Korea for the Paleoseismology, Active Tectonics, and Archeoseismology (PATA Days) meeting. I really enjoyed it. It was great to see old and new friends, catch up on the latest developments, and to travel in southern South Korea.
Here is a presentation/overview I made for my students and colleagues for our seminar:
PPT
Here is the paper I wrote for the meeting: pdf.

I spent some nice time with my friends Koji Okumura and Shmulik Marco:

It was also an interesting trip because my father was based at the Pusan East (K-9) air base in 1951. He was curious to hear about the trip and mentioned that he turned 21 there. He said they played a lot of cards and that a few times he got to go off base to help his friends who worked at a reservoir.

Monday, May 26, 2014

Structure from Motion micro documentary from Merri Lisa Trigilio

Readers may know my current obsession with Structure from Motion (SfM). Here is a new 5 minute long documentary from Merri Lisa Trigilio on SfM. It is based on some work we have been doing on the volcanoes around the San Francisco volcanic field and the interaction between a possibly active fault and the 50-60ka SP lava flow.

Structure From Motion from Merri Lisa Trigilio on Vimeo.


Here are more SfM posts

Monday, September 2, 2013

Short Course at LIPI : Techniques in Active Tectonic Study

In July 2013, Gayatri Marliyani and I taught a short course at LIPI in Bandung, Indonesia on Techniques in Active Tectonic study. I put together almost 30 lectures on various topics in active tectonics, neotectonics, tectonic geomorphology, paleoseismology, earthquake geology, and related topics. Special thanks to Mudrik Daryono (course coordinator for LIPI/ITB/GREAT), Irwan Meilano (ITB/GREAT), Danny Hilman Natawidjaja (LIPI/GREAT), Eko Yulianto (LIPI/GREAT), and the participants.

Gayatri built a nice website with all of the freely available lectures and other course content. We also recorded most of the lectures and they are on youtube.

The course web site is: http://activetectonics.la.asu.edu/lipi/. Look under the schedule link for the lectures and the link for some exercise content.

Group picture on field trip along the Lembang Fault.

Tuesday, January 24, 2012

Monday, August 8, 2011

Wallace Creek: New radiocarbon results and slip rate estimates of the San Andreas Fault in the Carrizo Plain

Our team along with Sinan Akciz and Lisa Grant-Ludwig from UC Irvine just finished a SCEC-supported project to re excavate a few of the trenches from the now famous work published as Sieh and Jahns, 1984 at Wallace Creek. While the slip rate of the San Andreas Fault has been well established at about 36 mm/yr from that work, it is only constrained by a few radiocarbon dates. With our experience working in the area and the enhanced capabilities of the W. M. Keck Carbon Cycle Accelerator Mass Spectrometry Laboratory  at UC Irvine, we proposed that it was time to revisit the ages of the main offset channel at Wallace Creek.

Aerial view of open excavations (photograph by Wendy Bohon, ASU)


View Larger Map


The effort was highlighted in a local newspaper: http://www.sanluisobispo.com/2011/08/07/1709285/quake-research-san-andreas-fault.html .


Here is our SCEC abstract that was just submitted (the title of this blog entry is the same):

Revisiting Wallace Creek: New radiocarbon results and slip rate estimates of the San Andreas Fault in the Carrizo Plain

S.O. Akciz, D.E. Haddad, W. Bohon, L. Delgadomendes, G. Marliyani, B. Salisbury, T. Sato, L. Grant Ludwig, J R. Arrowsmith

Sieh and Jahns (1984) determined the slip rate of the San Andreas fault (SAF) at Wallace Creek in the Carrizo Plain, and thereby provided an anchor for nearly all data-driven models of the southern San Andreas fault behavior. Their landmark study has been referenced hundreds of times and is a critical constraint in many related studies and in hazard estimates for the south-central SAF. Slip rate estimates at Wallace Creek (33.9±2.9 mm/yr) and at Van Matre Ranch site
(29.3-35.6 mm/yr; Noriega et al., 2006) agree well within measurement uncertainty, and with the 30–37 mm/yr velocity gradient across the SAF from decadal timescale geodetic measurements (Schmalzle, et al., 2006). Surprisingly, only a few detrital charcoal samples (9 samples at VMR, 8 samples at Wallace Creek) have been used to provide the absolute geochronological constraints. At a third site, Phelan Creeks, located ~ 2.5 km SE of Wallace Creek, 23 trenches were opened and over 400 charcoal samples were collected (Sims et al., unpublished data) to provide additional slip rate constraints, but the detailed study was never published.

New paleoseismologic investigations at the Bidart Fan site, ~5 km SE of Wallace Creek, indicate that southern SAF in the Carrizo Plain has apparently ruptured, on average, every 88 years (45-144 yr for individual intervals) between ~A.D. 1350 and 1857 (Akciz et al., 2010). B4 LiDAR (light detection and ranging) data analysis by Zielke et al. (2010) also found that only ~5.5 m of slip occurred along the SAF in the Carrizo Plain in 1857 and at least since ~A.D. 1400, and none of the earthquakes generated displacements larger than 5 meters (Grant Ludwig et al., 2010).

Slip per event and earthquake timing constraints can be tested against slip rate information to assess the steadiness of slip. Therefore, these new data and the geochronological limitations of the published slip-rate studies emphasize the need to improve, if not confirm, the existing slip-rate estimates by providing additional geochronological constraints. In August, 20111, we re-excavated T7 and T11 from Sieh and Jahns' study, photologged the trench walls (1:10) and collected a total of 30 new detrital charcoal samples from different stratigraphic layers from both of the trenches. Trench logs and radiocarbon results will be presented.


References:
Akciz, S.O., Grant Ludwig, L., and Arrowsmith, J R., 2009, Revised dates of large earthquakes along the Carrizo section of the San Andreas Fault, California, since A.D. 1310±30. Journal of Geophysical Research-Solid Earth, v. 114, B01313-6841.


Akciz, S.O., Grant Ludwig, L., Arrowsmith, J R., Zielke, O., 2011. Century-long average time intervals between earthquake ruptures of the San Andreas fault in the Carrizo Plain, California: Geology, v. 38, p. 787-790.


Grant Ludwig, L., Akciz, S.O., Noriega, G. R., Zielka, O., Arrowsmith, J R., 2010. Climate- Modulated Channel Incision and Rupture History of the San Andreas Fault in the Carrizo Plain: Science, 327, 5969, p. 1117-1119.


Sieh, K. E., 1977, Late Holocene displacement along the south-central reach of the San Andreas Fault, Ph.D. dissertation, Stanford University, Stanford, California, 219 pp.


Sieh, K.E., and Jahns, R.H., 1984, Holocene Activity of the San-Andreas Fault at Wallace Creek, California: Geological Society of America Bulletin, v. 95, p. 883-896.


Zielke, O., Arrowsmith, J R., Ludwig L G., Akciz, S.O., 2010. Slip in the 1857 and Earlier Large Earthquakes Along the Carrizo Plain, San Andreas Fault: Science, 327, 5969, p. 1119-1122.