The Salt River in central Arizona has a spectactular set of fluvial terraces developed along it. I have lead a number of field trips along the Salt River for outreach and most importantly for our GLG451 Field Geology I course where we use a site along the Salt River for a mapping exercise. I have recently updated the materials associated with that exercise in anticipation of this Spring's class which will include a virtual component.
Tour from ASU to the Salt River site.
Drone overflight of the key sites for the exercise.
These were of great interest to Professor Troy L. Pewe of Arizona State University's Department of Geology. He moved to Arizona from Alaska and converted his research from permafrost to desert processes. I was lucky to learn from him when I first came to ASU in 1995. He took me under his wing and shared with me much of what he had learned. Most importantly, he helped me to learn the field trips and field sites he had developed and discovered. I am extremely grateful to him. I recognize Brian Gootee who was a great friend of the Pewe Family and who has preserved much of the Pewe legacy at the Arizona Geological Survey.
Pictures from those early field trips with Prof. Pewe.
We recently visited the Warford Ranch Volcano which is a low shield volcano that is part of the Sentinel-Arlington volcanic field of southwestern Arizona. It is about 3 million years old. It was a favorite field trip destination of Prof. Ronald Greeley. Shelby Cave worked on the Sentinel-Arlington field for her Ph.D. dissertation under the supervision of Prof. Greeley and after his passing she worked with Prof. Amanda Clarke.
Google maps location for Warford Ranch (NW of Gila Bend, AZ).
Professor Clarke is teaching the Advanced Field Geology course and she took the group to Warford Ranch volcano to examine its volcanology. I did some UAS-mapping to help with the documentation. This blog entry presents some of the products of the overflights with our Mavic Air and Phantom 4 Pro.
Oblique overviews
I flew the Mavic Air high to get some views over the volcano to assess its general form and the relation to adjacent landforms and geology.
View to the north. The cars are lower left are in our parking spot. LINK to jpg
Fissure zone on SW side of higher topography. People for scale. Not sure the purpose of the excavation. LINK to jpg
Masked and socially distanced field work. LINK to jpgVideo overflight.
sUAS mapping
Along with the free flying overviews, I flew in mapping mode (using the PX4D mapper app) over most of the volcano taking 1778 images in mapping mode. I processed those in Agisoft Metashape to produce a colored point cloud, digital elevation model, and orthophoto. The latter two can be the basis of more mapping in ArcMap.
Tour of the data and its processing in Agisoft Metashape and ArcMap.
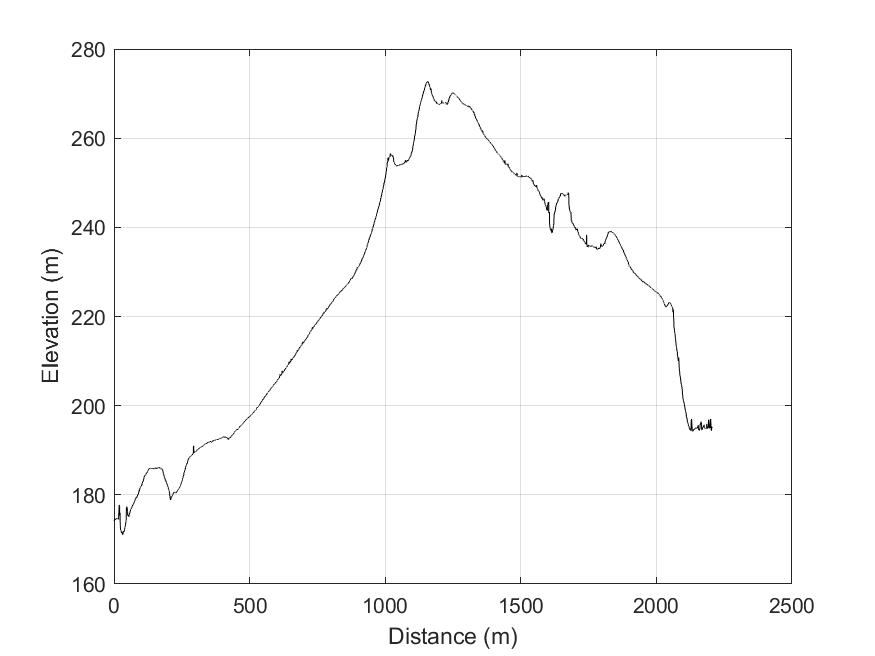
The video presented above discusses the topographic profile cut from the DEM in ArcMap towards the end. This would be the basis for the geologic cross section, preferably without vertical exaggeration.
Topographic profile location. Bent along the path of our Saturday November 22, 2020 tour. LINK to png.
Topographic data text file: LINK and MATLAB script to plot it: LINK
At least 3 earthquakes (M3.2, M4.1, M4.0) occurred last night 11 km NE of Black Canyon City, Arizona (I am sorry to have missed being at a NASA meeting in Washington D.C.!). It was widely felt across central Arizona including greater Phoenix (USGS' Did You Feel Ithas >4800 responses by 3:30 am). USGS estimates 4.6M people were exposed to weak shaking.
The sequence began with a M3.2 at 8:59 pm (foreshock). The M4.1 mainshock occurred at 11:29 pm within 2 km of the foreshock. 20 minutes later and 4.6 km SSW the M4.0 aftershock occurred. An M3.1 event occurred in the area Fri May 08 2009. There are no mapped active faults nearby but the roughly north-south orientation is consistent with the bedrock geologic structure in the area and note the mapped active faults to the east (Horseshoe, Carefree, and Sugarloaf--all similar orientation
Seismogram recorded at ASU processed by John D. West. PDF of above
Seismograms recorded at ASU processed by John D. West. PDF of above
There is a very cool large landslide near to Black Canyon City (see this post), but the earthquakes and landslides are not associated. I would think that the slide was shaken enough to move, and certainly the steep slopes of the region should have produced some rockfalls and other mass movements from this earthquake sequence.
The Black Canyon City landslide (BCL) is a spectacular deep seated structure located northeast of Black Canyon City, Arizona. It does not appear to pose much harm to structures etc. but it is an interesting feature worthy of study. Such examinations are useful for understanding the geologic setting under which they develop (in this case bedded Tertiary rocks and good local relief), appreciating the potential contributions to the landscape evolution in the area with a similar setting, and for characterizing the underlying structural processes.
Figure 1. Google maps of the Black Canyon City landslide area.
I was first introduced to the BCL in the late 90s by Nick Priznar from Arizona Department of Transportation and then Phil Pearthree (Arizona Geological Survey) and I taught an Advanced Field Geology class together with one weekend focused on it. Lee Amoroso (USGS) also contributed significantly I subsequently used it in Geomorphology courses over the years (e.g., picture of group having lunch in crestal graben). Link to old pages. David Haddad worked for AZGS and contributed to mapping the quadrangle that contains the BCL: Ferguson, C.A., Haddad, D.E., Johnson, B.J., Guynn, J.H., Spencer, J.E., and Eddy, D.L., 2008,
Geologic map of the east half of the Black Canyon City 7 ½' Quadrangle and the west half of the
Squaw Creek Mesa 7 ½' Quadrangle, Maricopa and Yavapai Counties, Arizona: Arizona Geological
Survey Digital Geologic Map DGM-64, 1 sheet, scale 1:24,000, with 27 p. text.
Hurien Helmi is working with me on an M.S. degree and he has chosen to focus on the BCL which should be really great! As part of Hurien's work, we have wanted to produce high resolution maps of the BCL. Hurien has done some work with our balloon systems, but the BCL is in a fairly windy place and thus it has been a bit of a struggle to get good results. Yesterday, we went to the BCL with Professor Srikanth Saripalli our SESE colleague and flew a drone there with good results (hence the topic of this blog entry). I want to summarize the results of the Structure from Motion results from the trip. Stay tuned for Hurien's careful work. This effort is also part of a project with JPL colleagues exploring the power of structure from motion with applications to topographic mapping from space (GAZING).
Sri bought a new DJI Phantom 2 Vision Plus and we used it along with the PIX4D app running on his phone. It worked quite well in that we were able to fly for effectively 15 minutes on each of two batteries (about 10 minutes of mapping time--as indicated in the app).
Figure 2. Overview of the three missions presented as hillshades computed from 0.1 m per pixel digital surface models.
Along with the field acquisition challenge, I wanted to see the differences in results from two main pieces of Structure from Motion software: PIX4D--for which Sri has a license--and Agisoft Photoscan--with which my students and I have more experience (and for which we have a license). In this presentation, I will only show the results from Agisoft Photoscan given their cursory nature. I computed 3D models and present short videos of the texture mapped meshes from Photoscan below as well as a few screen captures. Very importantly, the 3D georeferencing only comes from the GPS tags in the original jpgs from the Phantom!. In addition, I computed digital surface models (DSM) from the models and exported 10 cm versions as geotiffs which I loaded into ArcMap and computed hillshades and cut a few topographic profiles. Aside from the topographic tilt and some other georeferencing issues, the results are impressive for a relatively low amount of effort. It seems that the software can manage the fisheye lens view from the Phantom's camera.
Mission 1 (10 minute flight 80 m above launch point): We covered the toe area of the slide in mission 1. The results are pretty good aside from a gap in the coverage.
Figure 3. Mission 1 overview. Camera positions are indicated as blue rectangles (used). The "lawnmower patter" is evident.
Figure 4. Mission 1 texture map 3D view.
3D visualization of mission 1 coverage
Mission 2 (4 minute flight 40 m above launch point): We made a small flight over the toe area where there are clear fault scarps associated with deformation of the slide (as well as significant fissuring and collapse features).
Figure 5. Mission 2 overview. Camera positions are indicated as blue rectangles.
3D visualization of mission 2 coverage
Figure 6. Toe area DSM. Topographic model shows toe scar well but the whole model has a northwestern tilt due to the simple GPS control on the images for georeferencing.
Mission 3 (11 minute flight 80 m above launch point which is only about 20 or so meters above the upper portion of the slide): We moved up to the slide body and flew over the extensional system at the head of the slide. Note some images were not used (dots in the camera locations from Photoscan)
Figure 7. Mission 3 overview. Camera positions are indicated as blue rectangles or dots (not used?).
Figure 8. 3D views over textured mesh of upper portion of slide.
3D visualization of mission 3 coverage
Figure 9. Upper portion of the slide DSM. Extensional features are quite evident with 10 m deep troughs. Georeferencing is ok.
Last night, a M4.7 earthquake occurred between Flagstaff and Sedona (just west of Munds Park). I hope it was not too scary for my friends and colleagues. It sounds like it got their attention! I agree with Professor Brumbaugh from NAU who said: "It was a large enough earthquake to be felt, but not quite large enough to really get too concerned about" (link).
The USGS shakemap indicates that light shaking is reported from north Phoenix to north of Flagstaff. If you know someone who felt it; tell them to go to that site and record their perceptions.
The earthquake occurred in an area where there are some active faults, most notably the Lake Mary fault system south of Flagstaff. Here is the epicenter on a map of USGS Quaternary Active Faults:
Here it is with historic seismicity (from Jeff Lockridge). There was an M3.5 within a few km of this event on November 25, 2014.
The epicenter is right on top of the Oak Creek Fault. So it could be associated with that fault, but it would need to be located further east given the eastward dip of the Oak Creek fault. I see that the focal mechanism is available now from the USGS and it is a NE-trending mostly normal faulting event. The Earthly Musings blog has a nice entry on the Oak Creek Fault.
Here is the earthquake on a compilation of active faults and earthquakes that I put together:
Here is the PDF. There have been some earthquakes in that area over the years.
I joined a field trip to the Pinacate Volcanic Field in Northern Mexico this past weekend. It was a part of the Planetary Volcanology class taught by David Williams and Amanda Clarke. It was beautiful and very interesting. I had never been there, but just stared at it on google earth:
In this post, I present some field photographs from the tour, followed by a few slides from Amanda Clarke from a lecture on Water-Magma Interactions:
Crater Elegante: nice example of the phreatomagmatic features in great evidence.
Nice bomb sag in the surge units.
Amanda Clarke explaining the eruption-related features.
Model for Crater Elegante formation.
As we drove around, we saw some nice tephra that Amanda got excited about.
Conos Tecolote y Mayo
Overview looking south at the Sierra Pinacate. Note boundary between the more vegetated and tephra covered flow to left with fresher looking darker flow to right.
Cerro Colorado
View to the northeast looking at Cerro Colorado (feature to the right middle ground).
Cerro Colorado layered mostly surge deposits (view to east).
Cerro Colorado layered mostly surge deposits (note various clast compositions).
Cerro Colorado view towards the southwest; note nested "hippodrome" of late stage eruptive center(?).
Some lapilli--mostly armored, a few accretionary.
Water - Magma interactions
Amanda shared a few slides with me.
Cool slide showing the eruption energy versus water/magma ratio and the various phenomena and forms we may observe.
Forms versus eruption energy with increasing interaction with water.
Dramatic weather today! Looks like as much as 4” rainfall in the last 24 hours in the northern part of Maricopa County drove lots of exciting runoff.
ABC 15 picture of flooded roads near New River AZ.
Here are a couple of links from the Maricopa County Flood Control District for a data-oriented view of rainfall and runoff: http://www.fcd.maricopa.gov/Rainfall/rainfall.aspx -- main page. http://www.fcd.maricopa.gov/Rainfall/Raininfo/raininfo.aspx -- links to tabular rainfall reports. http://alert.fcd.maricopa.gov/alert/Google/v3/wx.html -- this is a good data page (Mobile version. Click on the Dataset tab and you can see some different maps (1 day rainfall or Streamflow data for example). Click on a station and a little window will popup and you can see various measures versus time. There is a “plot” link at the bottom of the popup and you can see a plot of precip or streamflow versus time at that sensor.
For example, I see the 5568 Skunk Creek at I-17 pressure transducer indicates more than 12,500 cubic feet per second today about 10 am (this link on the sensor suggests that 12,100 cfs is the 25 yr flood).
If you click on the layers tab, you can see a number of different data products including those from radar.