Showing posts with label seismology. Show all posts

Thursday, June 25, 2026

June 24, 2026 Venezuela M7.2 and 7.5 earthquake doublet

Yesterday at 6 pm local time (3 pm in Arizona) pair of large earthquakes occurred in rapid succession along the northern coast of Venezuela. The first, an M7.2, ruptured at a depth of about 20 km and about 180 km west of Caracas. 40 seconds later (while shaking from the first was still propagating), the second, an M7.5, initiated at a depth of about 10 km and ruptured from the eastern end of the M7.2 towards the east (towards Caracas). This pair of events, a foreshock followed rapidly by an adjacent mainshock, is being called a "doublet". The first ruptured into the second like one domino following into the next.

This is a devastating pair of earthquakes for Venezuela; they are shallow and occurred near to populated regions. The US Geological Survey anticipates significant loss of life and economic impacts.

The foreshock occurred along the large east-west Yaracuy valley that connects to the northern Venezuelan coast. Cities with hundreds of thousands of residents (San Felipe, Puerto Cabello, Los Guayos) experienced very strong to severe shaking (a total of ~1M people).

The second event with its ground motions propagating along with those of the first, ruptured eastward along the northern Venezuelan coast nearly to Caracas (a distance of ~150 km). This "directivity"--rupture moving in the same direction as the waves it is producing--can significantly enhance ground motions and that is likely what happened for places like Caracas. For this event, more than 2.5M people experienced very strong to severe shaking for at least tens of seconds. Eyewitness reports show many buildings collapsed. Many slopes may have failed in the nearby mountains, enhancing damage via cascading hazard.

The earthquakes occurred along a well known active fault zone variably named the Boconó-San Sebastián-El Pilar Fault zone. It represents the plate boundary between northern South America and the Carribean plates. The Carribean plate (north side of the fault) moves eastward about 20 mm/yr relative to the South American Plate. This dextral motion was thus accommodated in part by these two mostly right lateral earthquakes. This side to side rather than up-down sense of motion--even though the rupture was along the coast--is consistent with the lack of observation of any tsunamis.

These are the largest earthquakes to occur in the region in at least the past century. M6 events have occurred within 250 km in the last century, but nothing this large. An ~M7.4 event occurred in 1812 in the same area as yesterday's M7.2, while an ~M7.6 occurred possibly along these faults just offshore Caracas in 1900.

Aftershocks are occurring and will continue to make rescues more challenging. I expect that today the response will be vigorous and we will know more about this catastrophe.

Authoritative Links:

Additional useful links:

Some papers I found useful:

  • Audemard, F. A., 2007, Revised seismic history of the El Pilar fault, Northeastern Venezuela, from the Cariaco 1997 earthquake and recent preliminary paleoseismic results, J Seismol, 11, no. 3, 311–326, doi: 10.1007/s10950-007-9054-2.
  • Pousse‐Beltran, L., R. Vassallo, F. Audemard, F. Jouanne, J. Carcaillet, E. Pathier, and M. Volat, 2017, Pleistocene slip rates on the Boconó fault along the North Andean Block plate boundary, Venezuela, Tectonics, 36, no. 7, 1207–1231, doi: 10.1002/2016TC004305.
  • Higgins, M., P. C. La Femina, J. C. Weber, H. Geirsson, G. A. Ryan, and C. Wauthier, 2021, Strain Partitioning and Interseismic Fault Behavior Along the Caribbean‐South American Transform Plate Boundary, Tectonics, 40, no. 8, e2021TC006740, doi: 10.1029/2021TC006740.

Thursday, June 30, 2022

A simple evolutionary model for fragile geologic features

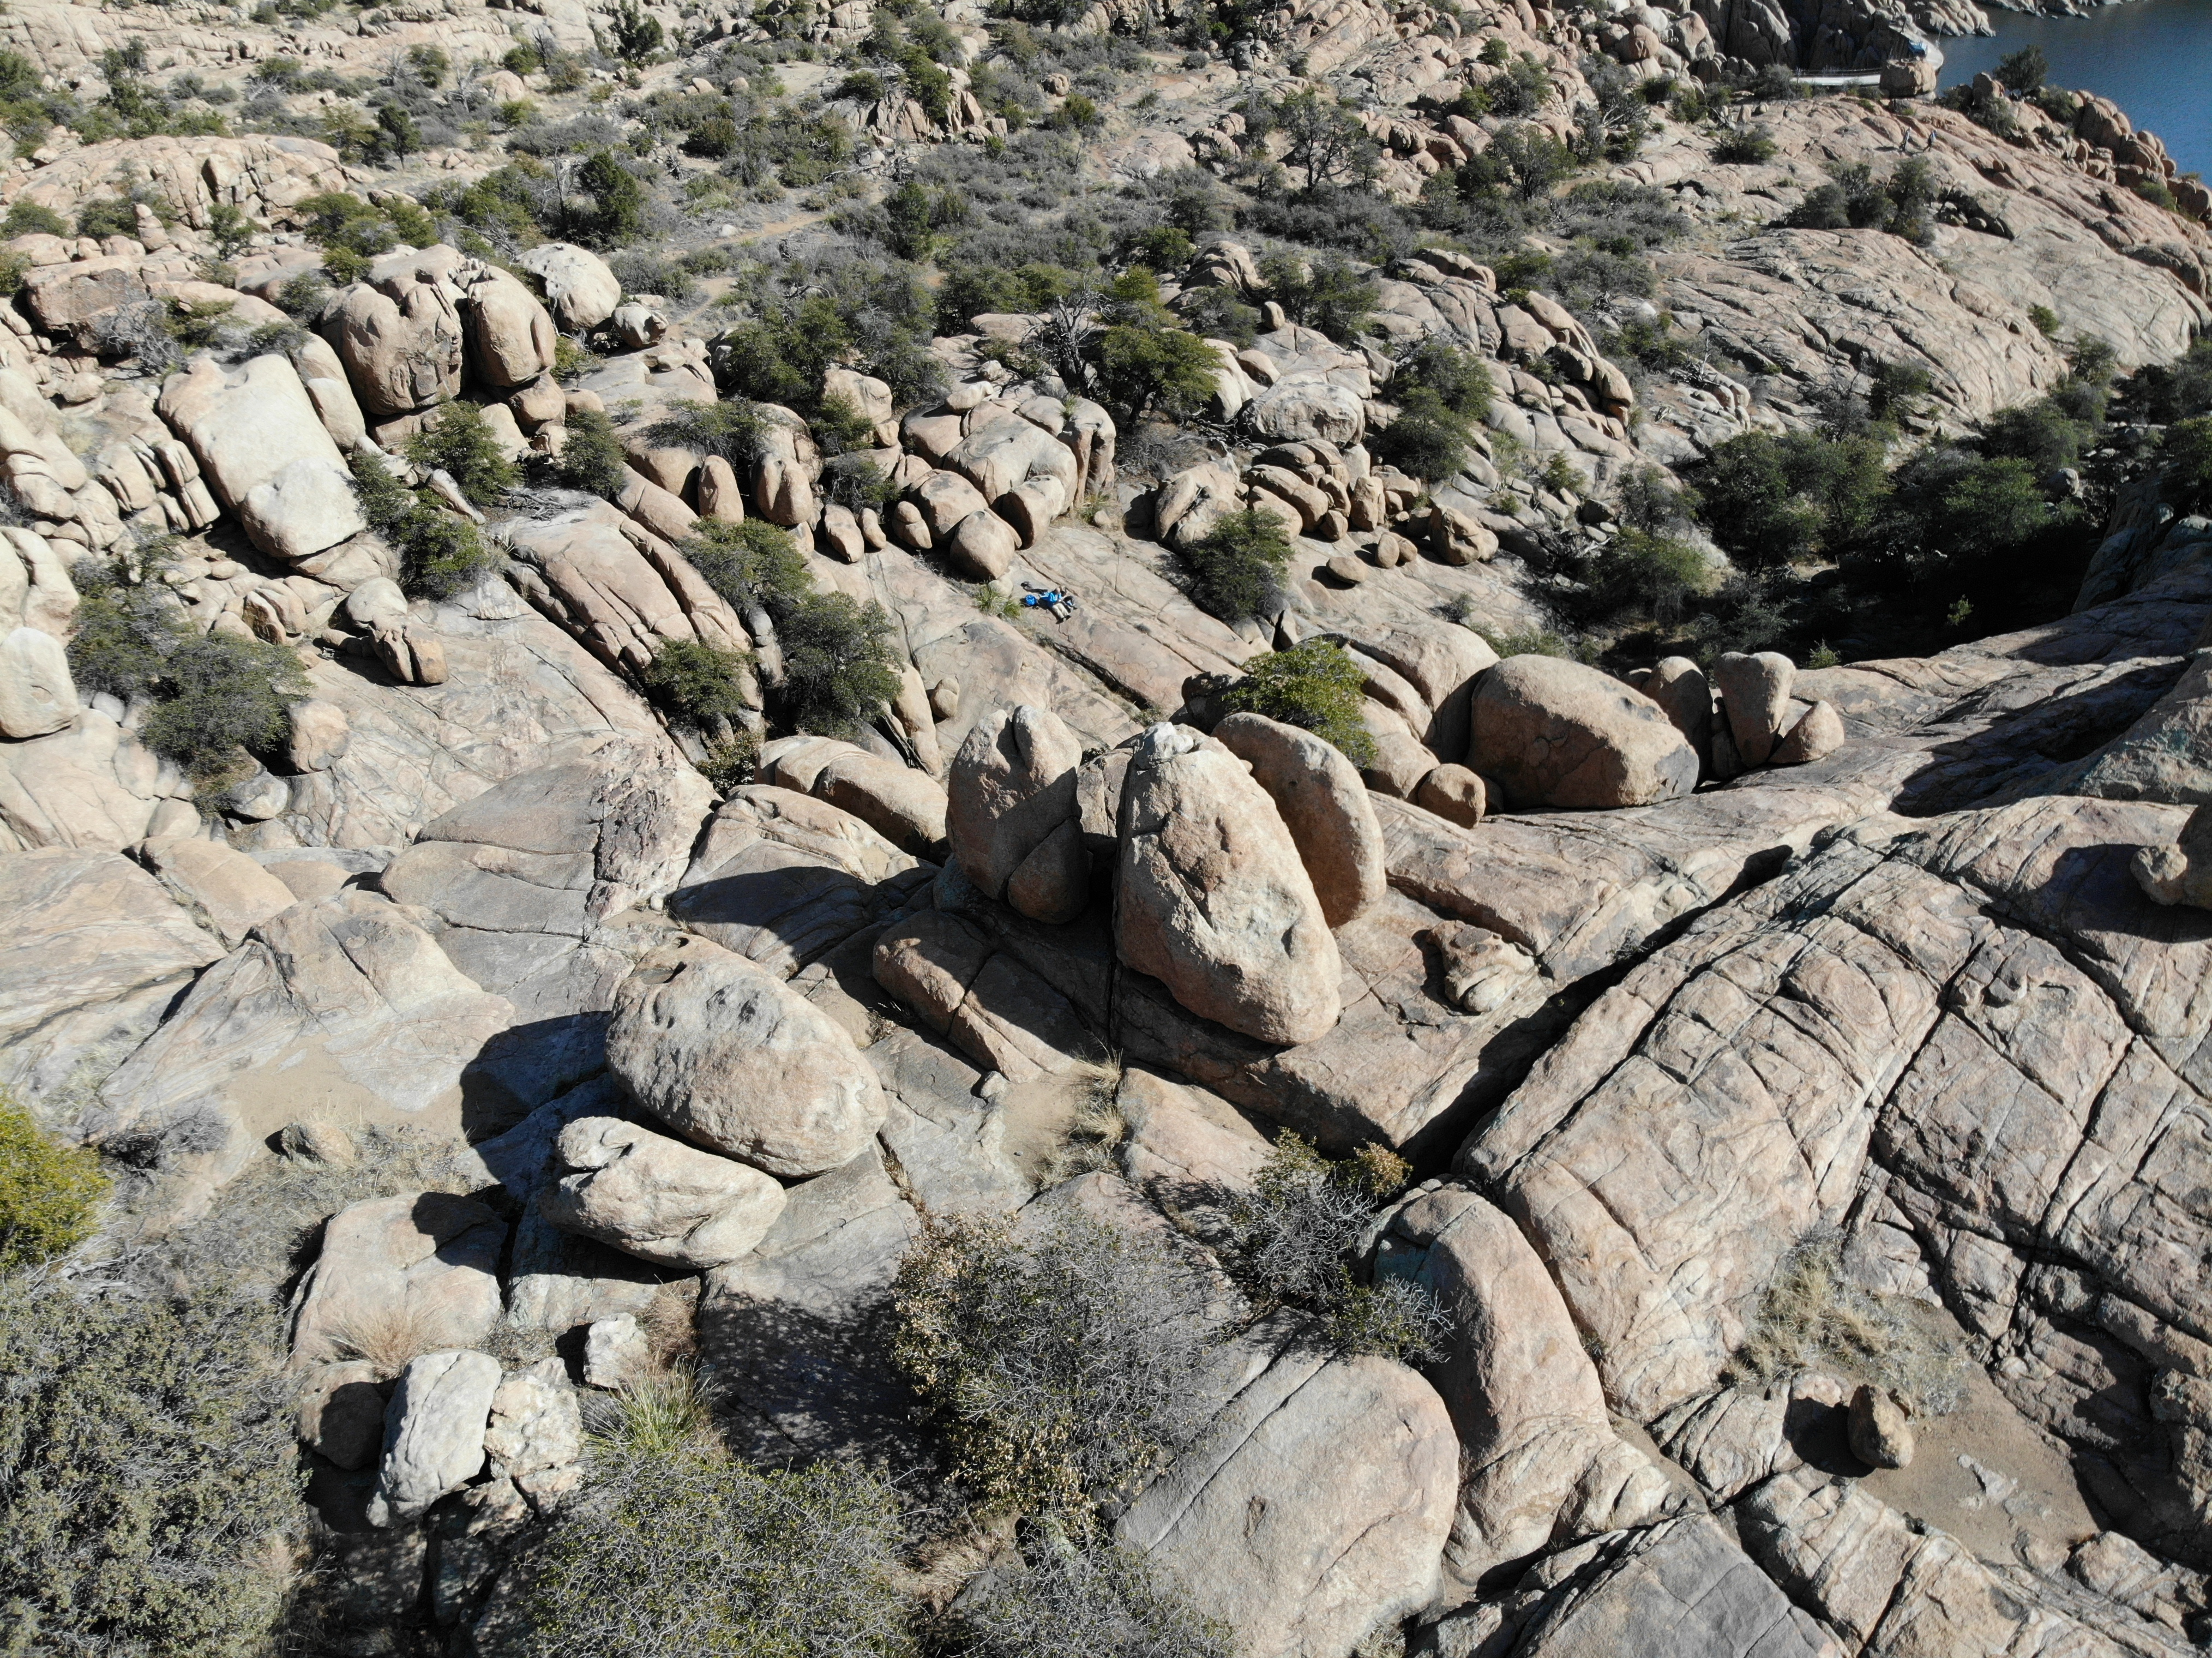
The fragility of geologic features, such as precariously balanced rocks (PBRs), can be measured by a simple parameter like α. For the case of a PBR is the smallest of the angles between the vertical from the center of mass and its rocking points. In a landscape, each object will have a fragility and so the ensemble will be a fragility distribution. The controls on the initial distribution and its long term evolution will be from the environment and its history (material properties, landscape evolution (lowering), weathering, shaking, etc.). The distribution can be disturbed by an earthquake (or other loading like windstorm, human impacts, etc.) which abruptly removes features with fragility below a threshold α.

Example of PBRs in Granite Dells, Arizona

I started to think an analogy with a fruit tree. I am not sure this is an original idea maybe I heard it somewhere. The progressive ripening of the fruit can be interrupted by a shake which will remove completely a subset of the most ripe fruit. For the case of the rocks, the ripening is a gradual decrease in fragility over time and then a fragility reset of a subset rather than removal after they are toppled in a shaking event. Ripening continues and the processes repeat over time. This simple model does not account for changing ripening rates or much variation in shaking effects other than threshold α. The basic idea then for seismic hazard is that the fragility distribution at a location reflects the history of the long term ripening and episodic shaking and reset. Therefore, if we can produce fragility distributions for landscapes that otherwise comparible (ripening and threshold α), we might be able to say which has seen more recent shaking and of what severity. This does not directly address the age control for the history and this remains a significant problem.

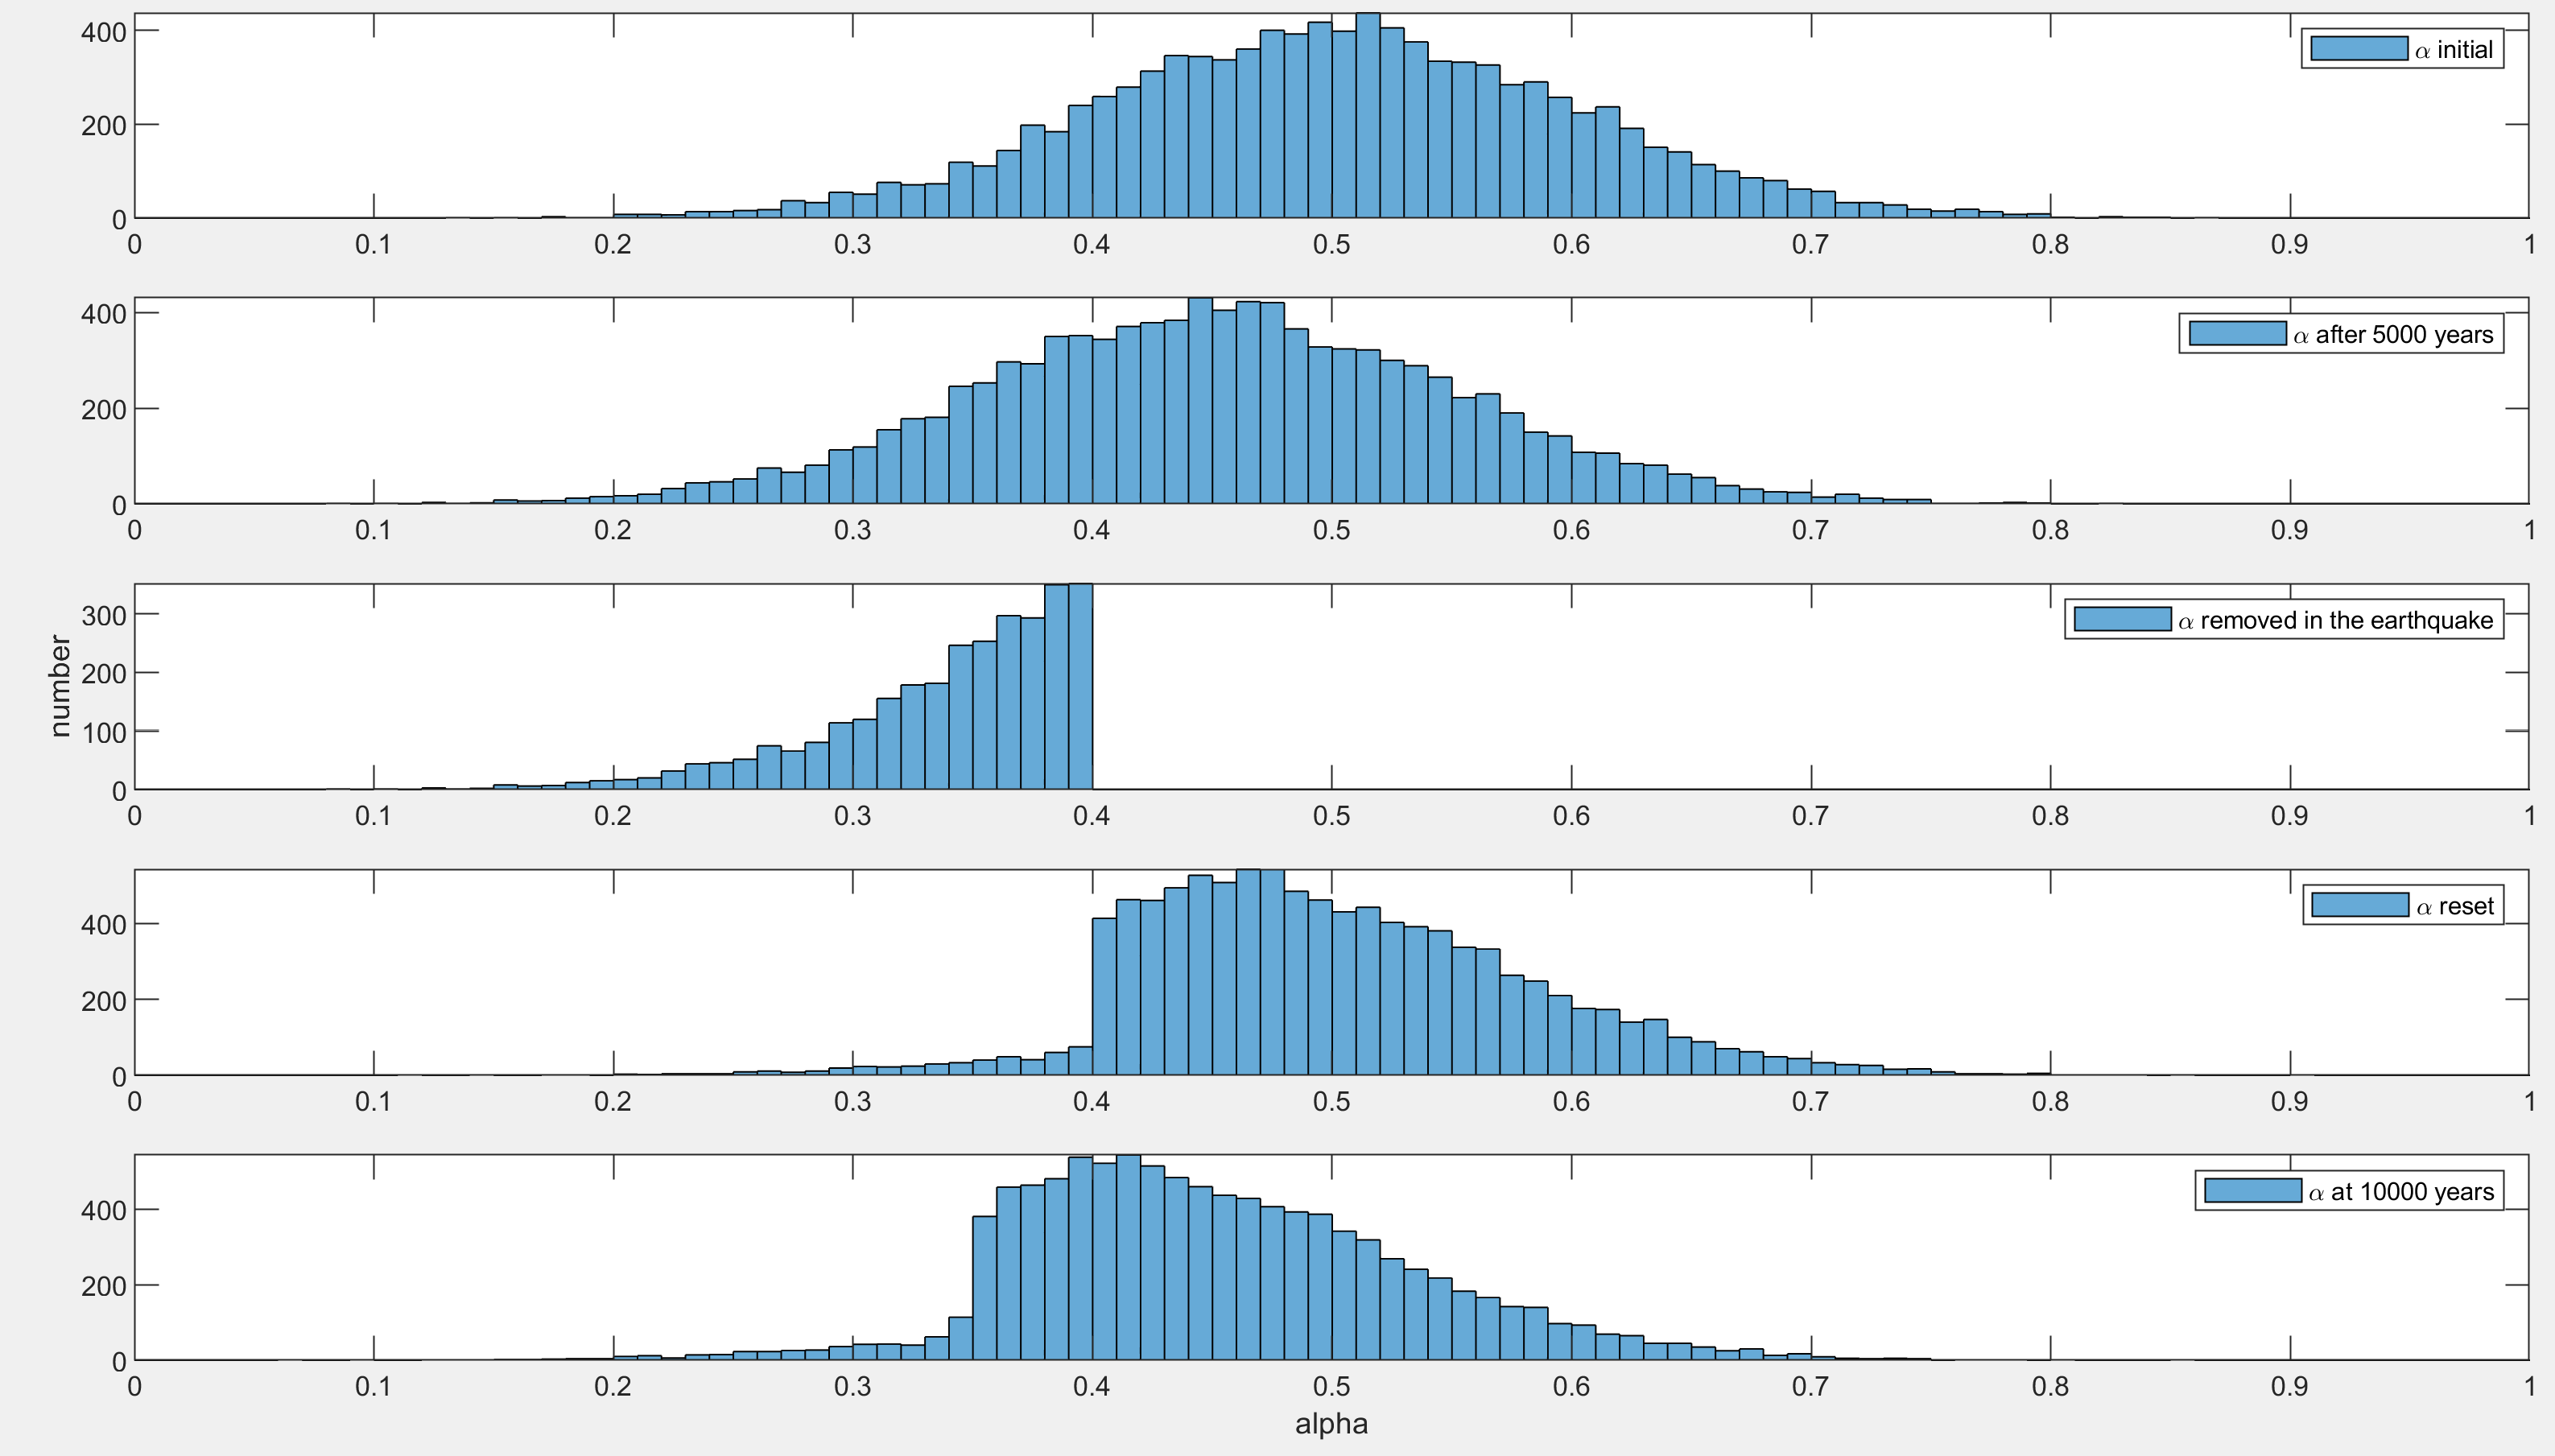
I wrote a simple code to explore this problem with the hope that it helps us explain and isolate the basic controls on fragility distributions. See the figure below which presents the fragility distributions through the experiment.The algorithm is simple:

  • Set up: Specify number of objects, the initial α distribution (assume normal), the ripening rate distribution (also normal; this is the loss of fragility per year), the timing of the earthquake, the threshold α, and the max time
  • Interseismic period 1: ripen α until the earthquake (begin and end are the upper two plots below)
  • Earthquake: remove α < threshold α (third plot below) and reset those α drawing from the same initial distribution (fourth plot below)
  • Interseismic period 2: ripen α until the end of the model time (final plot below)

Fragility distributions through the experiment. Upper plot is initial α. 2nd plot is α and the end of interseismic period 1. 3rd plot shows removed objects with α < threshold α. 4th plot is reset distribution of < threshold α Note that some α results below threshold α. Lowest plot shows continued ripening until the end of the model.

The additional two figures show the evolution of fragility with time of a subset of the objects and a spatial view of the randomly positioned features, their fragility at the time of the earthquake, and the circled objects that failed. The evolutionary diagram helps illustrate the interruption of the more fragile features by the event while the others do not notice. The map provides an idea of the search challenge that this scenario presents.

Evolution of fragility of a subset of the objects. The red star indicates the time of the earthquake and the threshold α.
Map view randomly positioned features, their fragility at the time of the earthquake, and the circled objects that failed.
Maybe more realistic with a more sparse set of features and a lower threshold α (0.3 as opposed to 0.4 above).

This is just a sketch of the problem, but it is a toy model in which we can explore the importance of the distribution widths, timing of earthquake, etc.

The MATLAB code is in this repository: https://github.com/jrarrowsmith/MATLAB-Geomorphology; make sure to get the script PBRevolution.m and functions ripenPBR.m and shakePBRs.

Friday, May 15, 2020

Accumulating some links for M6.4 Tonopah area Nevada earthquake May 15, 2020

An M6.4 earthquake occurred this morning in SW Nevada 56 km west of Tonopah and 202 km ESE of South Lake Tahoe. It was widely but lightly felt across southern Nevada and the central California from the Sierra Nevada to the coast. It occurred in an area of NW-oriented dextral shearing called the Walker Lane. The size of the event would suggest that there is surface rupture. Fortunately, it is an area of low population density so hopefully no one was hurt and the damage is low. Aftershocks are continuing.

I am collecting some links in this blog entry:

Friday, March 8, 2019

Idea for an earthquake intensity exercise based on 1857 Ft. Tejon earthquake data

I was cleaning some files yesterday and I found an old exercise I had deployed when I was first teaching Introductory Geology. It was intended to help students understand earthquake intensity (vs.) magnitude. I took the felt intensities as reported by D. C. Agnew and K. Sieh (1978), A documentary study of the felt effects of the great California earthquake of 1857, Bull. Seismol. Soc. Amer., vol. 68, pp 1717-1729 and compiled some of the more easily interpreted ones into a table and then provided a simple map of California for the students to map the intensities. Here is a link to the compiled data from Agnew and Sieh. THe work of Kerry Sieh on the 1857 earthquake is seminal. I think it was an ok exercise, but there are probably more interesting and more recent datasets. For example, I like the twitter-based work that is coming from the USGS colleagues. It should be possible to take some sample tweets and do an intensity mapping.

The 1857 earthquake and its foreshocks and aftershocks are fascinating an a sobering reminder of what will happen one day in California.

This figure from Toké and Arrowsmith, 2006 shows the 1857 foreshocks and the mainshock distribution (the latter is what the exercise mentioned in the last paragraph is supposed to look like) and compares it with the historic Parkfield earthquakes.

Sunday, November 13, 2016

Accumulating links and interpretation for earthquake M7.8 - 53km NNE of Amberley, New Zealand

I am accumulating some links and thoughts with respect to today's earthquake M7.8 - 53km NNE of Amberley, New Zealand. I hope that the damage won't be too severe and I am sending positive energy to the people there. Magnitude and depth were increasing as the seismologists reviewed the seismograms. It was felt widely across New Zealand (Felt reports:


>15,000 felt reports as of 17:14 UTC

Here is a sketch of the NZ tectonic setting (from https://twitter.com/stef92320):

March 6, 2017 update:
GNS updates including offshore faulting from high resolution bathymetry

Jan. 1-4 updates:
GNS field work blog
New Zealand Geographic article
Before and after images

Dec. 5 updates:
Kekerengu Fault field work blog

Nov. 28 updates:
Kekerengu Fault and prior trenching (GNS)

Nov. 27 updates:
Repeat satellite imagery showing big shift! (Chris Milliner)
Geospatial Information Authority of Japan interesting differencing
EarthJay blog post

Nov. 25 updates:
Farm track ruptured by fault drone video
The Kekerengu Fault rupture pictures from Julian's Rock and Ice Blog

Nov. 23 updates:
NPR report with some of the amazing drone videos and other commentary
Temblor site with some of the amazing drone videos and other commentary

Nov. 21 updates:
Amazing drone video of the Kekerengu Fault rupture
Kaikora coastal uplift
Skateboarders making the most of the rupture....
Rob Langridge GNS Science talks earthquakes with JR

Nov. 19 updates:

GeoNET: viewing the earthquake from space
GeoNET: measuring the earthquake with GPS
Fagereng, Complex Earthquake Raises Complex Questions (EOS)
Trembling Earth blog entry 2

Nov. 17 updates:
Evolving magnitudes on quakestories
Preliminary landslide mapping

Nov. 15 and 16 updates:
GNS Blog
Trembling Earth blog entry 1
COMET for interferogram and interpretation
Kaikoura district faults report by GNS
Temblor interpretation
Commentary in Spinoff--GNS scientists interviewed
Science commentary
Duffy and Quigley commentary in the Conversation
Tsunami damage Banks Peninsula
Digital Globe images of surface rupture from Ryan Gold (USGS)
Preliminary Sentinel-1 interferogram
Yahoo News Seafloor uplift article

Nov. 14 updates:
Geonet what we know so far
Geonet update
IRIS Recent Earthquake Teachable moment
IRIS Special Event Site: South Island, New Zealand
Surface rupture, landslides, damage:

Nov. 13 Interpretion: The magnitude and depth (as long as it does not get much deeper) could be consistent with a rupture on the Hope Fault. The location and to some degree the focal mechanism would be more consistent with one of the thrust faults further to the west. As information has flowed in, I get a sense that the rupture was deeper and mostly underneath the main crustal faults and approaching the subduction interface below.

Reports are coming in that there is a tsunami that was generated and has hit the coast with heights of a few meters in places.

Interesting to see aftershocks aligned along the faults to the northeast. USGS tectonic summary suggested some slip along the megathrust. I wonder if it is in a sort of accretionary complex above the megathrust and transitioning into to the shearing plate boundary (hence the depth and steeper dip and oblique slip focal mechanism). USGS finite fault and source time function show deeper slip almost 100 km northeast (and 60 seconds) from the hypocenter (making this a complex earthquake). Peak slip is ~ 4m (oblique) at about 25 km down dip distance from the surface along a 38 degree to the NW dipping surface. See also IRIS backprojection results. But that is necessarily a simple model. The Cape Campbell GPS station moved 2 m E, 1 m N, and 1 m up apparently (scroll down) and that would imply shallower or greater or more complex slip than the simple inversion implies. It makes me wonder what surface rupture will look like. USGS finite fault source now indicates strong ground motions and likely seafloor uplift zone (Kaikora to almost Wellington; see the image below).

Here is a mashup of GNS faults with the USGS location, shaking estimates, additional earthquakes, and focal mechanism as of 16:23 UTC:

Links (some coming from twitter feed)

News links:

Monday, November 2, 2015

Links and commentary on earthquakes 11 km NE of Black Canyon City, Arizona (~11:30 pm local time; November 1, 2015)

At least 3 earthquakes (M3.2, M4.1, M4.0) occurred last night 11 km NE of Black Canyon City, Arizona (I am sorry to have missed being at a NASA meeting in Washington D.C.!). It was widely felt across central Arizona including greater Phoenix (USGS' Did You Feel Ithas >4800 responses by 3:30 am). USGS estimates 4.6M people were exposed to weak shaking.

The sequence began with a M3.2 at 8:59 pm (foreshock). The M4.1 mainshock occurred at 11:29 pm within 2 km of the foreshock. 20 minutes later and 4.6 km SSW the M4.0 aftershock occurred. An M3.1 event occurred in the area Fri May 08 2009. There are no mapped active faults nearby but the roughly north-south orientation is consistent with the bedrock geologic structure in the area and note the mapped active faults to the east (Horseshoe, Carefree, and Sugarloaf--all similar orientation


PDF of above map


Seismogram recorded at ASU processed by John D. West. PDF of above


Seismograms recorded at ASU processed by John D. West. PDF of above

There is a very cool large landslide near to Black Canyon City (see this post), but the earthquakes and landslides are not associated. I would think that the slide was shaken enough to move, and certainly the steep slopes of the region should have produced some rockfalls and other mass movements from this earthquake sequence.

Here are some links for the event:

Here are some links for background on Arizona earthquakes:

Saturday, April 25, 2015

Accumulating a few links on the April 25, 2015 M7.9 Nepal Earthquake

An M7.8 earthquake occurred 77km (48mi) NW of Kathmandu, Nepal April 25, 2015. It apparently occurred along the Main Himalayan thrust fault system which accommodates the substantial convergence between India and Eurasia. The last great earthquake in this region along the Himalayan arc was about 240 km southeast--the 1934 M8 1934 Nepal-Bihar earthquake--and caused major damage to Kathmandu and about 10,600 casualties. This 2015 earthquake is likely to have been devastating. More than 3.6 million people are expected to have felt very strong shaking.

May 12, 2015: a large aftershock occurred on the eastern end of the April 25, 2015 rupture zone: USGS summary

See this Jonathan Amos/BBC explainer on Why Nepal is so vulnerable to quakes. And, here is a blog entry from NY Times on Himalayan seismic risk. Here is the anticipation of damage and casualties from USGS Pager.

The focal mechanism, inverted finite fault, and the aftershocks are consistent with the interpretation of the event along the Himalayan Thrust system.

Here are some links I am accumulating:

Monday, December 1, 2014

November 30, 2014 M4.7 earthquake between Sedona and Flagstaff

Last night, a M4.7 earthquake occurred between Flagstaff and Sedona (just west of Munds Park). I hope it was not too scary for my friends and colleagues. It sounds like it got their attention! I agree with Professor Brumbaugh from NAU who said: "It was a large enough earthquake to be felt, but not quite large enough to really get too concerned about" (link).

Arizona Geological Survey colleagues (some ASU alumns!) are responding. Here is a blog entry from Arizona Geology on the event. Here is a nice map from them with better locations:

The USGS shakemap indicates that light shaking is reported from north Phoenix to north of Flagstaff. If you know someone who felt it; tell them to go to that site and record their perceptions.

Here is the seismogram from Tucson:

and if you go to the IRIS page on the eventyou can hear it!

The earthquake occurred in an area where there are some active faults, most notably the Lake Mary fault system south of Flagstaff. Here is the epicenter on a map of USGS Quaternary Active Faults:


Here it is with historic seismicity (from Jeff Lockridge). There was an M3.5 within a few km of this event on November 25, 2014.
Here is the epicenter on the Geologic Map of Arizona:
The epicenter is right on top of the Oak Creek Fault. So it could be associated with that fault, but it would need to be located further east given the eastward dip of the Oak Creek fault. I see that the focal mechanism is available now from the USGS and it is a NE-trending mostly normal faulting event. The Earthly Musings blog has a nice entry on the Oak Creek Fault. Here is the earthquake on a compilation of active faults and earthquakes that I put together:
Here is the PDF. There have been some earthquakes in that area over the years.

Additional links:

I will continue to update as I learn more.

Tuesday, February 12, 2013

Collecting some links on the North Korean nuclear test

Valuable information about North Korea's nuclear test comes from seismological recordings of the shock waves produced in the event.

One of the interesting things is that because the North Korean nuclear tests are basically done in the same place, seismograms of the events at long distances have quite similar characteristics. Their amplitudes, however, do vary with the increasing yield of the events.

Here are a few links I have come across:

How do we know it was an explosion and not an earthquake? First of all, that part of North Korea is not known for historic earthquakes. Secondly and more to the point, with seismometers arrayed around the source area regionally and globally, the explosion will cause all of the first motions to be AWAY from the source. If it is an earthquake, two quadrants will be pulled IN towards the source and two quadrants will be pulled out ("double couple").

--disclaimer: this is not my area of expertise, but I do find it fascinating. To some degree, monitoring of nuclear tests using seismology has driven the development of seismology and seismic networks and that lets us learn a lot more about earthquakes globally.