Monday, December 1, 2014

November 30, 2014 M4.7 earthquake between Sedona and Flagstaff

Last night, a M4.7 earthquake occurred between Flagstaff and Sedona (just west of Munds Park). I hope it was not too scary for my friends and colleagues. It sounds like it got their attention! I agree with Professor Brumbaugh from NAU who said: "It was a large enough earthquake to be felt, but not quite large enough to really get too concerned about" (link).

Arizona Geological Survey colleagues (some ASU alumns!) are responding. Here is a blog entry from Arizona Geology on the event. Here is a nice map from them with better locations:

The USGS shakemap indicates that light shaking is reported from north Phoenix to north of Flagstaff. If you know someone who felt it; tell them to go to that site and record their perceptions.

Here is the seismogram from Tucson:

and if you go to the IRIS page on the eventyou can hear it!

The earthquake occurred in an area where there are some active faults, most notably the Lake Mary fault system south of Flagstaff. Here is the epicenter on a map of USGS Quaternary Active Faults:


Here it is with historic seismicity (from Jeff Lockridge). There was an M3.5 within a few km of this event on November 25, 2014.
Here is the epicenter on the Geologic Map of Arizona:
The epicenter is right on top of the Oak Creek Fault. So it could be associated with that fault, but it would need to be located further east given the eastward dip of the Oak Creek fault. I see that the focal mechanism is available now from the USGS and it is a NE-trending mostly normal faulting event. The Earthly Musings blog has a nice entry on the Oak Creek Fault. Here is the earthquake on a compilation of active faults and earthquakes that I put together:
Here is the PDF. There have been some earthquakes in that area over the years.

Additional links:

I will continue to update as I learn more.

Monday, November 24, 2014

Planetary Volcanology field trip to the Pinacate Volcanic Field (November 22-23, 2014)

I joined a field trip to the Pinacate Volcanic Field in Northern Mexico this past weekend. It was a part of the Planetary Volcanology class taught by David Williams and Amanda Clarke. It was beautiful and very interesting. I had never been there, but just stared at it on google earth:

In this post, I present some field photographs from the tour, followed by a few slides from Amanda Clarke from a lecture on Water-Magma Interactions:

Crater Elegante

The Pinacates are in a biospheric reserve: http://elpinacate.conanp.gob.mx/.
Crater Elegante: nice example of the phreatomagmatic features in great evidence.
Nice bomb sag in the surge units.
Amanda Clarke explaining the eruption-related features.
Model for Crater Elegante formation.
As we drove around, we saw some nice tephra that Amanda got excited about.

Conos Tecolote y Mayo

Overview looking south at the Sierra Pinacate. Note boundary between the more vegetated and tephra covered flow to left with fresher looking darker flow to right.

Cerro Colorado

View to the northeast looking at Cerro Colorado (feature to the right middle ground).
Cerro Colorado layered mostly surge deposits (view to east).
Cerro Colorado layered mostly surge deposits (note various clast compositions).
Cerro Colorado view towards the southwest; note nested "hippodrome" of late stage eruptive center(?).
Some lapilli--mostly armored, a few accretionary.

Water - Magma interactions

Amanda shared a few slides with me.
Cool slide showing the eruption energy versus water/magma ratio and the various phenomena and forms we may observe.
Forms versus eruption energy with increasing interaction with water.

Saturday, November 15, 2014

SoSAFE and Earthquake Geology Geochronology workshop report (Southern California Earthquake Center)

Kate Scharer (USGS), Mike Oskin (UC Davis) and I organized a geochronology workshop for the Southern California Earthquake Center community this fall. We emphasized methodologies useful for investigating fault slip behavior over time scales from 102 to 106 years. That included Terrestrial Cosmogenic Nuclides, Uranium Series, and Optically Stimulated Luminescence. We did not talk so much about 14C given its relative maturity, but we certainly recognize its continued value.

Kate lead the charge on the completion of the workshop report. It has a nice summary of the topics covered (here is the original agenda). I had a sense of a real acceleration in the number and quality of applications of the methods and the resulting rich depiction of deformation rates and their variations across time and space in Southern California. I was particularly moved by the climate modulation on the development of landforms (alluvial fans, channels, etc.) that serve as markers as well as the possible temporal coherence of wet and dry times across the region. I think that this modulation and coherence can be exploited with more intensive application of geochronology.

I learned a lot more geochronology, especially having just been at the EarthScope Geochronology Institute a week or so earlier--note that the talks and some of the videos are up (where we covered some similar topics and where Kate was a speaker on 14C). It was very nice to see many SCEC friends and colleagues.

Tuesday, November 11, 2014

Fall 2014 Workshop on the Future of the Amphibious Array

Led by Professor Geoff Abers (speaking above), we organized the Workshop on the Future of the Amphibious Array which was held at Snowbird in the Wasatch Mountains of Utah--and which I remember well from early EarthScope meetings.

The workshop charge was to make the case for further amphibious experiments (emphasizing the idea of crossing the shoreline). We need to articulate the case for integrated amphibious science. And, we were to evaluate the Cascadia experience. We were guided by the EarthScope Science Plan and by the GeoPrisms planning documents. I also helped summarize a breakout session. Here is the PPT.

Greg Anderson from NSF was traveling with Silverwing:

I had a decent view of the Grand Canyon on the way home:

GSA Annual Meeting 2014

I spent almost a week in Vancouver, CA for the Geological Society of America Annual meeting. It is a very beautiful city with dramatic views and great food.

--view from the convention center

Becky Flowers giving science motivation talk at the EarthScope Geochronology and the Earth Sciences Institute and short course. The short course was my main purpose for being there as I helped to organize it. I learned a lot. For example, a date is an outcome of the analysis and calculation, while age is an interpretation (S. Bowring). I gave a welcome (PPT) and an EarthScope science motivation talk (PPT).We kicked off the Gecchronology student award program: PPT. We have a number of videos of the presentations and the pdfs, etc. which should be on line soon.

I also enjoyed seeing many old friends and colleagues.

Fall 2014: PATA-Days in Busan, Korea

I had a wonderful trip to Busan, Korea for the Paleoseismology, Active Tectonics, and Archeoseismology (PATA Days) meeting. I really enjoyed it. It was great to see old and new friends, catch up on the latest developments, and to travel in southern South Korea.
Here is a presentation/overview I made for my students and colleagues for our seminar:
PPT
Here is the paper I wrote for the meeting: pdf.

I spent some nice time with my friends Koji Okumura and Shmulik Marco:

It was also an interesting trip because my father was based at the Pusan East (K-9) air base in 1951. He was curious to hear about the trip and mentioned that he turned 21 there. He said they played a lot of cards and that a few times he got to go off base to help his friends who worked at a reservoir.

Monday, September 29, 2014

Some TU Dresden SfM and lidar links

I got a nice tip from Univ.-Prof. Dr. Klaus Reicherter about some good structure from motion (SfM) and lidar links at the Technical University Dresden:


I also note for reference that we have the OpenTopography Tool Registry

Friday, September 12, 2014

Southern California Earthquake Center 2014 meeting group picture

Many of my students and colleagues and I just returned from the 2014 Southern California Earthquake Center meeting. It was really great: so much energy, so many old and new friends and colleagues. It is a very strong community with a world-leading emphasis on earthquake system science. I am on the Planning Committee and was very engaged many aspects of the meeting.

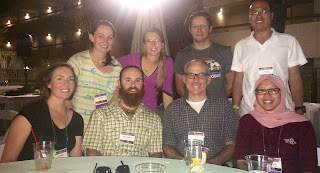
Here is a fun picture from the meeting:

Back row: Kate Potter (ASU), Kendra Johnson (Colorado School of Mines), Ed Nissen ((Colorado School of Mines), Wei Zhanyu (Chinese Earthquake Administration). Front row: Emily Kleber (ASU), Barrett Salisbury (ASU), me, and Gayatri Marliyani (ASU). I am always proud of my students and associates!

I flew to Palm Springs for the meeting and on the flight home, I had a nice view of the San Andreas Fault zone in the Indio Hills just to the east of Palm Springs and the meeting location. Here are two pictures:


The main fault trace cuts diagonally across the middle of the upper view. Two large scale right lateral offsets are evident along the fault. On the right side of the lower image, secondary (normal?) faults cut the uplifted alluvial fan units.

Along the San Andreas Fault in this area the the B4 laser scan data were collected by the Ohio State University, the National Center for Airborne Laser Mapping, USGS, and UNAVCO. The data are available on line at OpenTopography. Here is a screen capture of the hillshade in google earth:


And, here is the kmz file for that area of the hillshade of the DEM I calculated at OpenTopo.

Sunday, August 24, 2014

24 August 2014 M6 Earthquake northern San Francisco Bay area (6km NW of American Canyon, California)

An M6 strike-slip earthquake occurred in the northern San Francisco Bay area last night (3:20 am local time). It is reported as 6 km NW of American Canyon and between Napa and Vallejo. This is the biggest event in the Bay Area since the 1989 M6.9 Loma Prieta earthquake. Aftershocks are following and will continue. Not a lot of additional data and interpretation are yet available, but they will be soon! There might be some surface rupture, and there should be coherent ground cracking (could end up being a semantic point!). There will be a lot of landslides, and there seems to be structure damage in especially some of the older brick buildings in the region. It sounds like people have been injured from falling debris. I hope everyone will be ok. The Did You Feel It mapping shows that shaking was very strong to severe in the north Bay area and it was felt widely across the region.

The UC Berkeley Seismological Laboratory and the Southern California Earthquake Center Data Center (link) have nice maps and lists showing the location of the main shock and the aftershocks elongate along the rupture zone. There is some useful commentary about the faults and their recent activity at the bottom of the main Main USGS page on the event.


The earthquake occurred in the area of the West Napa Fault. The focal mechanism is consistent with the expected right lateral slip. I made the figure using the USGS Quaternary Faults data base and the focal mechanism from the USGS. The center of the focal mechanism is on the epicenter.

Here is a kmz of the hillshaded digital elevation model (Napa watershed gathered by National Center for Airborne Laser Mapping in 2003) at 2 m resolution of the area of the main shock (click to download the kmz):

I georeferenced one of the maps from the Wesling and Hanson final technical report (click to download the kmz). Lineaments are targets for field survey:


Here is folder with georeferenced images.

I notice a Plate Boundary Observatory station not far from the southern end of the likely rupture zone (P261), but no updates yet for today to see a change in its position. There are also borehole strainmeters that apparently felt the squeeze.

Here are a few links:

Tuesday, August 19, 2014

Maricopa county flood control rainfall and runoff links -- Phoenix area heavy ppt and runoff August 19, 2014

Dramatic weather today! Looks like as much as 4” rainfall in the last 24 hours in the northern part of Maricopa County drove lots of exciting runoff.


ABC 15 picture of flooded roads near New River AZ.

Here are a couple of links from the Maricopa County Flood Control District for a data-oriented view of rainfall and runoff:
http://www.fcd.maricopa.gov/Rainfall/rainfall.aspx -- main page.
http://www.fcd.maricopa.gov/Rainfall/Raininfo/raininfo.aspx -- links to tabular rainfall reports.
http://alert.fcd.maricopa.gov/alert/Google/v3/wx.html -- this is a good data page (Mobile version. Click on the Dataset tab and you can see some different maps (1 day rainfall or Streamflow data for example). Click on a station and a little window will popup and you can see various measures versus time. There is a “plot” link at the bottom of the popup and you can see a plot of precip or streamflow versus time at that sensor.
For example, I see the 5568 Skunk Creek at I-17 pressure transducer indicates more than 12,500 cubic feet per second today about 10 am (this link on the sensor suggests that 12,100 cfs is the 25 yr flood).

If you click on the layers tab, you can see a number of different data products including those from radar.

There is another page that makes maps: http://www.fcd.maricopa.gov/Rainfall/ALERT/rainMaps.aspx -- select a map and then click make map and you can then click on a gage to see some tabular data.

Both sites are a bit clunky but can be entertaining. The Flood Control District maintains a pretty impressive sensor network.

Other links:
rainlog -- community contributed rainfall data
Maricopa County Community collaborative rain, hail, and snow network

Thursday, August 7, 2014

[Old fashioned] surveying using an electronic total station: a ~20 year old paper reminds me of the power of detailed 3D mapping

I recall as a graduate student how revolutionary the electronic total station was. I became completely obsessed, and wrote a user manual (after some spectacular failures in the field with my advisor who I think was ready to send me home...). While the original version was written in 1993, I did not put it online until 1999 or so: Total station manual. Koji Okumura also put together a nice guide about the same time: Koji's Digital Mapping Homepage.

I was really interested in both the technical aspects of the measurements, but also the power that they provided in mapping topography and structures for example. I recently reread this nice paper from others who shared my enthusiasm at about the same time: Philpotts, et al., The electronic total station--a versatile, revolutionary new geological mapping tool, Journal of Geoscience Education, v. 45, p. 38-45, 1997.. I wanted to write a similar paper.... Along with a nice review of the basic operations and applications, this paper has a bit of vector analysis that is handy to remember for the processing of any x y z data. I tackled a bunch of that material, especially applied to faults and stress in the Advanced Structural Geology class (week 13).

Time passed and what would take a day to do with the total station (1000 shots) can be done in far less than a second with LiDAR (see the vast holdings and our educational efforts at OpenTopography or Structure from Motion (see for example these SfM posts) topography, but the principles are similar.

Here are a few old images and projects:


Topographic map from the Kule Sayi area along the Altyn Tagh fault (Washburn, et al., 1999).

Topographic map from the Liwiqiming area along the Altyn Tagh fault (Cowgill, et al., 2000).

Topographic map from the Hog Lake site along the San Jacinto Fault (project lead by Tom Rockwell). This site has a lot of nice maps and photos.

Black Canyon City landslid repeat surveys: site.

3D view from surveys at the Montroig Golf Course along the El Camp Fault in southern Spain (from Field training course in paleoseismology Cambrils, Spain, Februrary 2-11, 2001). This site has a lot of nice maps and photos.

Sunday, June 29, 2014

M5 Earthquake in Eastern Arizona last night (June 28, 2014)

This is quite interesting and unusual historically. There was an earthquake in SE Arizona near the New Mexico border at about 10 pm local time. Here are a few links:

  1. USGS site on the event
  2. USGS site Did You Feel It shows that it was widely and lightly felt across southeastern Arizona and southwestern New Mexico
  3. TUC vertical long period seismogram from Tucson show the event and aftershocks
  4. Arizona earthquake history from AEIC does not show a lot of activity historically there
  5. AZ Oil and Gas information I wonder if associated with oil and gas activities? AZ Is Hydraulic Fracturing a Threat in Arizona? (from AZGS).
Normal fault focal mechanism with roughly N-S striking planes is generally consistent with the few active faults in the area (USGS QFaults; see also AZGS fault map). I will post more when I have some more time.

Monday, May 26, 2014

Structure from Motion micro documentary from Merri Lisa Trigilio

Readers may know my current obsession with Structure from Motion (SfM). Here is a new 5 minute long documentary from Merri Lisa Trigilio on SfM. It is based on some work we have been doing on the volcanoes around the San Francisco volcanic field and the interaction between a possibly active fault and the 50-60ka SP lava flow.

Structure From Motion from Merri Lisa Trigilio on Vimeo.


Here are more SfM posts

Tuesday, April 1, 2014

Links and comments on M8.2 - 95km NW of Iquique, Chile April 2, 2014

This evening there was a M8.2 earthquake along the northern Chilean subduction zone. It caused very strong shaking along the Chilean coast. There have been numerous aftershocks. It was appropriately configured to generate a tsunami. Max heights in the source region are 2 m. It appears that beyond Chile and Peru the tsunami concerns are low (I saw that the expectation was ~20 cm in coastal California).

The Chilean portion of the subduction zone along western South America has generated the largest recorded earthquake historically (in 1960 M9.5; That was on the southern end of the zone). This is in an area where there has been some strong locking noted.

Here are some links:

  • USGS main page: Summary Includes estimated losses (pager) and also expected (shakemap) and felt (dyfi) intensities.
  • Here is low dip focal mechanism consistent with expectations: scientific

Here is the IRIS Teachable moment page. I has some nice content for presentations on the event.

This map may work to show the local seismicity: http://earthquake.usgs.gov/earthquakes/map/ Navigate to the region and zoom in.
Try this one too: http://www.iris.edu/seismon/ see this: Regional focus

Pacific Tsunami warning center: Pacific region see the Pacific region statement: text Here is the forecast tsunami height map and the travel time map

This site is accumulating observations: http://earthquake-report.com/2014/04/01/massive-earthquake-offshore-tarapaca-chile-on-april-1-2014/

Image showing degree of seismic coupling and location: http://t.co/rgwmyacIw1. See this paper: http://gji.oxfordjournals.org/content/194/3/1283.full

Good blog entries:
Quakehunters

Here are a few useful news links:
http://www.latimes.com/world/worldnow/la-fg-wn-chile-quake-larger-20140401,0,2045484.story#axzz2xgQBG1Wx
http://santiagotimes.cl/8-2-quake-hits-northern-chile-triggering-regional-pacific-wide-tsunami-warning/

Some more educational links:
Tsunamis Generated by Megathrust Earthquakes from IRIS

Monday, March 31, 2014

Exploiting high resolution topography data for advancing the understanding of mass and energy transfer across landscapes: Opportunities, challenges, and needs (USGS Powell Center working group)

"TIME FOR IN-DEPTH ANALYSIS WITHOUT DISTRACTIONS"--That is one of the opportunities presented to USGS Powell Center Working Groups. Indeed and quite pleasantly we have begun our discussions in the working group entitled "Exploiting high resolution topography data for advancing the understanding of mass and energy transfer across landscapes: Opportunities, challenges, and needs". This project is lead by Paola Passalaqua (UT Austin) and Patrick Belmont (Utah State). Here is a flyer on our project: link. We had our first meeting a couple of weeks ago in Fort Collins at the Powell Center and it was extremely stimulating. Lots of great discussion and sharing of ideas among a dynamic group. I very much enjoyed seeing old and new friends. We mostly worked on brainstorming a big review of the state of analysis of high resolution topography and so I think there will be a publication coming from that. We also had a quite interesting field trip to appreciate the geomorphic responses to the High Park Fire (for which there is some repeat lidar topography coverage). Here are some pictures. Stay tuned for more cool stuff and many thanks to my friends and colleagues for the chance to work together.

Friday, February 28, 2014

Science videos: naive efforts and connecting with the pros (for example, http://lifeonterra.com/)

I have been playing around with video production for science explanation and tutorials since some efforts in graduate school for the The Stanford Rock Fracture Project. Lately, I have generated many tutorial and lecture videos and pushed then to my youtube site: jrarrowsmith youtube. There are also many videos, some have been viewed more than 10,000 times on the OpenTopography youtube site.

My friend Merri Lisa Trigilio is a geoscientist who is now in the Film program at Montana State University. It has been fun to talk to her about filmmaking and we will work together in the coming weeks on a video project. Stay tuned for updates. I the meantime, have a look at the Life on Terra website--run by the film students at MSU.

As part of a Southern California Earthquake Center (SCEC) and OpenTopography collaboration, Sarah Robinson (former ASU M.S. student) and Andrew Whitesides (USC undergraduate) - supported by SCEC's ACCESS program (Advancement of Cyberinfrastructure Careers through Earthquake System Science) and in collaboration with numerous SCEC scientists and the OpenTopography team - produced a new educational video entitled LiDAR - Illuminating Earthquake Hazards. The video provides an introduction to both LiDAR technology as well as the earthquake science that is being done with the data.

Thursday, January 23, 2014

Spring 2014 Active Faulting and Surface Process Seminars

We have two nice seminars going now: Active Faulting and Surface Processes.

We have started to run the Active Faulting seminar and track it the last few semesters. Thanks to Emily Kleber and the other students for taking the lead and organizing and documenting. Emily says: "This semester we are focused on discussing current research projects and trending topics in active tectonics and tectonic geomorphology. Subject matter is centered around (but not limited to) quantitative structural geology, geomorphology, paleoseismology, and the acquisition and application of high-resolution topography to all of the above." Here is the web site: http://activetectonics.asu.edu/ActiveFaultingSpring2014.html .

The Surface Process seminar has been going since at least Spring 2008. The topics vary and it is run in the evenings at a faculty member or student home. We enter the critical zone of commentary and sometimes the topic is about the Critical Zone (from the top of the canopy to the bottom of the roots). This semester's topic is generally hillslope processes.