Wednesday, November 25, 2020

Warford Ranch volcano (Arizona) sUAS mapping

Introduction

We recently visited the Warford Ranch Volcano which is a low shield volcano that is part of the Sentinel-Arlington volcanic field of southwestern Arizona. It is about 3 million years old. It was a favorite field trip destination of Prof. Ronald Greeley. Shelby Cave worked on the Sentinel-Arlington field for her Ph.D. dissertation under the supervision of Prof. Greeley and after his passing she worked with Prof. Amanda Clarke.

Google maps location for Warford Ranch (NW of Gila Bend, AZ).

Professor Clarke is teaching the Advanced Field Geology course and she took the group to Warford Ranch volcano to examine its volcanology. I did some UAS-mapping to help with the documentation. This blog entry presents some of the products of the overflights with our Mavic Air and Phantom 4 Pro.

Oblique overviews

I flew the Mavic Air high to get some views over the volcano to assess its general form and the relation to adjacent landforms and geology.

View to the north. The cars are lower left are in our parking spot. LINK to jpg

View to the south-southwest. LINK to jpg

View to the south-southeast. LINK to jpg

Fissure zone on SW side of higher topography. People for scale. Not sure the purpose of the excavation. LINK to jpg

Masked and socially distanced field work. LINK to jpg

Video overflight.

sUAS mapping

Along with the free flying overviews, I flew in mapping mode (using the PX4D mapper app) over most of the volcano taking 1778 images in mapping mode. I processed those in Agisoft Metashape to produce a colored point cloud, digital elevation model, and orthophoto. The latter two can be the basis of more mapping in ArcMap.

Tour of the data and its processing in Agisoft Metashape and ArcMap.

Map downloads

Hillshade overview. 600 dpi pdf download: LINK.

Ortho image overview. 600 dpi pdf download: LINK.

Hillshade of peak area. 600 dpi pdf download: LINK.

Ortho image of peak area. 600 dpi pdf download: LINK.

Map data downloads

  • 0.1 m/pix DEM and hillshade downloads (tif): LINK
  • 0.1 m/pix orthoimage download (tif): LINK

Topographic profile

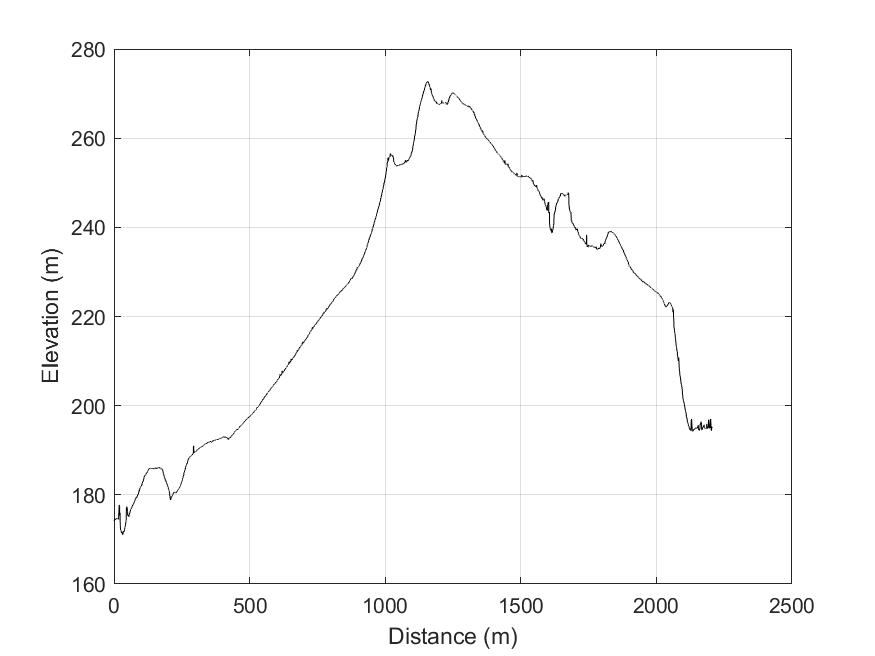
The video presented above discusses the topographic profile cut from the DEM in ArcMap towards the end. This would be the basis for the geologic cross section, preferably without vertical exaggeration.

Topographic profile location. Bent along the path of our Saturday November 22, 2020 tour. LINK to png.

Topographic data text file: LINK and MATLAB script to plot it: LINK

No vertical exaggeration. Link to png.

Vertical exaggeration. LINK to png

2021 ADDENDUM:
For the October 2021 field work, we are trying to use STRABOSPOT for the digital mapping. I prepared a few items to help:

  • Simple tutorial. The students need to do all but the very last step (uploading after the field) BEFORE we go to the field: PDF
  • Video tutorial. I recorded all of this on the browser and the tablet with narration.

Friday, November 6, 2020

Thank you to the American Geophysical Union and colleagues for the Paul G. Silver Award for Scientific Service

Thank you for this great honor of the Paul G. Silver Award for Outstanding Scientific Service. Recognition from AGU’s Geodesy, Seismology, and Tectonophysics Sections adds to its heft. I am happy that Paul’s family is represented. I know we have all benefited from Paul Silver’s leadership and legacy. I was fortunate to meet him on several occasions and appreciated his wit and the spark that drove major science activities on which I was later able to contribute. I am humbled to be in the same list as those who have been awarded before. Congratulations to Doug Toomey--the other recipient this year of the award.

This recognition reflects the efforts of many of my colleagues with whom I have shared numerous projects. I know that many of you are strongly dedicated to serving your families and the communities of your private and scientific lives. I hope that this honor can lift us all as we acknowledge efforts to coordinate activity for our broader good helping others.

It has been satisfying and stimulating to help with major earth science efforts and organizations including GeoPrisms, Southern California Earthquake Center, EarthScope, AGeS - Awards for Geochronology Student Research, and OpenTopography. I share this recognition with collaborators and friends in those organizations. Colleagues in the National Science Foundation and US Geological Survey have worked mightily to sustain support.

I was inspired to serve by the example of many, including mentors Dallas Rhodes, David Pollard, and Manfred Strecker. Arizona State University’s School of Earth and Space Exploration Prof. Jim Tyburczy showed me a firm and balanced approach to leadership. My service as associate and deputy to SESE Directors Hodges, Elkins-Tanton, and Wadhwa has given me an opportunity to learn about academic administration and help students, faculty, and staff.

I want to close with a thank you to family including my sister and her husband and their daughters. Our parents--a teacher and a mechanical designer--steadfastly supported me. In their retirement, they served as the Los Ranchos (New Mexico) farmer’s market managers. Their dedicated and steady service made the market an institution. Thank you to my wife Amanda for her love and clear thinking which keeps us going in the right direction.

Here is a video of this speech: LINK

Friday, October 16, 2020

Understanding and interpreting rapidly changing Earth surface processes across a template of a rapidly urbanizing and increasingly connected world

Understanding and interpreting rapidly changing Earth surface processes across a template of a rapidly urbanizing and increasingly connected world is a major challenge. Our ability to observe and measure features on the Earth surface is increasing in quality, resolution, and temporal repeat. Thus, we have an opportunity to move understanding beyond the assumption of steadiness. It is clear that many surface phenomena occur rapidly (e.g., wildfires and the subsequent drainage network response, volcanic eruptions, earthquakes, mass movements, etc.). Each is part of a cascade of precursory and subsequent processes.

Revolutions in Earth observing and the connectedness of humanity (e.g., internet of things, social media) provide a major opportunity to characterize surface process events across the world. But they also provide a great data discovery, integration, and analysis challenge. How to bring the disparate observations into a common and quantitative 4D framework so they can be examined, and rates of change measured? For example, satellite imagery such as that available from Planet.com provide a daily view of the Earth’s surface at <5m per pixel. This temporal and spatial resolution enables us to observe many phenomena at or near the spatial and temporal scales at which critical processes operate. Discovering these data is relatively straightforward, but their rapid integration with data for context, as well as with ground observations is difficult and time consuming. Integrating the synoptic view from the space-based platform with the typically less intentional but ubiquitous eyewitness views from social media posts or public image sharing platforms can provide essential ground truth, detailed observations of phenomena, and an indication of the human experience of the event.

For many events, a generic workflow can be imagined:

  1. Build on the well curated contextual geospatial data (landcover/land use, topography, imagery, 3D structures) to include (with proper geo- and temporal referencing) near real time Earth observations and compute if necessary derived products of interest (e.g., NDVI for vegetation health).
  2. Discover, locate in time and space, assess for veracity, and examine user contributed or freely posted images and videos from the ground (and maybe from UAS).
  3. Use the high geodetic accuracy of the framework to measure changes using space-based, airborne, and ground-based data. These changes may be spectral or 3D. Use the measurements to contribute to process-based models.
  4. Present predicted conditions (e.g., hazard maps and forecasts) potentially in a updating cycle defined by subsequent additional observations.
  5. Educate both in the short term (explain the event) and long term (enhance science and engineering literacy).

Several uses cases are evident:

  1. Wildfires: Map forest health using space imaging (NDVI) before, during, and after wildfire seasons. Much commercial space imaging is well configured for measuring vegetation vigor. Exposure of the built environment to the fires (and to subsequent debris flows) would be easy to explore, and hazard maps easily visualized. Including user contributed or freely posted images and videos from the ground (and maybe from UAS) during the fires and after would provide a sense of the detailed processes and phenomena.
  2. Debris flows in mixed wild-agricultural-urban environments: Flooding, especially by heavy sediment-laden flows, are hazardous and their conveyance highly sensitive to the complex 3D near surface environment which many include natural and built structures. Observations of them include larger watershed scale activation and evolution during storm events (space and airborne observations potentially combined with very high resolution 3D data from as built urban models and with on ground experiences from mobile phone picture and video). Flow simulations are available and may be useful for forecasting hazardous conditions, and also maybe updated and calibrated with detailed observations.
  3. Tsunami inundation in complex coastal environments: The 2011 Tohoku Japan earthquake and tsunami showed the very complex and rapid large scale interaction of the rising waters and the coastal Japanese environment. These were observed by some airborne and many haphazard ground-based views. Integrating those observations, and georeferencing imagery to help to measure inundation depths and flow velocities could be done with value for fluid dynamics simulations as well as for tsunamic education for coastal communities.
  4. ETC.

I wanted to capture this text that I contributed to a recent proposal and stash it here.

This is part of some ideas that I have been working on with capstone students in our capstone class. Here is a link to a presentation: LINK.

Friday, May 15, 2020

Accumulating some links for M6.4 Tonopah area Nevada earthquake May 15, 2020

An M6.4 earthquake occurred this morning in SW Nevada 56 km west of Tonopah and 202 km ESE of South Lake Tahoe. It was widely but lightly felt across southern Nevada and the central California from the Sierra Nevada to the coast. It occurred in an area of NW-oriented dextral shearing called the Walker Lane. The size of the event would suggest that there is surface rupture. Fortunately, it is an area of low population density so hopefully no one was hurt and the damage is low. Aftershocks are continuing.

I am collecting some links in this blog entry:

Wednesday, April 22, 2020

Many thanks to Petroleum Experts Limited for 2020 Donation

Petroleum Experts Limited has again provided the School of Earth and Space Exploration with licensed software for 2D and 3D kinematic modelling, geomechanical, fracture, and fault response modeling and fault and stress analyses. These licenses are valued at $2,223,600.00 US Dollars and will enable our faculty and students to build and analyze complex 3D fault models to develop understanding of tectonic processes and to anticipate earthquake hazards.

We have acknowledged this donation in our March 2020 SESE Newsletter (LINK) as well as express our thanks in our building displays:

We are grateful for this donation. The MOVE suite of software is a powerful environment for 3D interpretation. My students and colleagues are using it to build 3D fault models. We will begin to work on sedimentary architecture in extensional environments in the coming year. In addition, with continued support of the licensed software, we will develop course material for it for our geology majors.


Example image from Petroleum Experts/MOVE.

Tuesday, March 31, 2020

Accumulating links for M6.5 earthquake 72 km west of Challis Idaho 3/31/2020 4:52 pm

An earthquake occurred in Idaho today 72 km west of Challis Idaho and about 120 km northeast of Boise Idaho. Based on the magnitude and location, I would think that it looks to be a classic Basin and Range earthquake rupturing along the mountain front south and west of Stanley Idaho (if it occurred along the Sawtooth fault--the closest active fault). But the focal mechanism is more strike-slip; we will have to wait for some updates.

The event was widely felt in the Intermontane west with light to moderate shaking in Boise. It was felt as far as Salt Lake City, Bozeman, and Spokane. The strongest ground motions appear to have been in the relatively low population Challis National Forest. Numerous aftershocks are expected.


Location of the epicenter in the Sawtooth Mountains. The yellow line to the south is the Sawtooth fault. Note the focal mechanism indicating strike-slip sense of motion

Links:

Monday, March 30, 2020

Virtual field geology exercises for GLG451 Field Geology I Spring 2020

Even before the COVID-19 crisis changed everything, I was working this semester to build some virtual options for my Field Geology I (GLG451) course. Two students are physically unable to do the field work, and then another had a crisis and missed two weekend field trips. The course has three weekend field trips and then a mini camp over spring break.


Locations of the field trips.

I decided to try to build some digital versions of the field trips using very high resolution digital elevation models and orthophotos from our SUAS systems (thanks to Tyler Scott for doing the flying and the SfM work). I wanted these to be as similar as possible to what the regular students experience so I give some initial information on the maps as well as numerous pictures from the ground and videos from the sUAS. For most of the exercises in the case of my class, I also am providing rock samples to the students of each of the mapping units.

All of the information for each of the assignments is in a long pdf which has the text assignment, links to data and images, etc. and then some explanation. It also has a topographic profile for a cross section, etc.
I am very happy to share with anyone who might find these useful. Here are the modules and the current status:

ModuleStatusLink
Dreamy Draw, Phoenix Mountains, AZDoneLINK
Goldfields, Superstition Mountains, AZDoneLINK
Salt River, Bush Highway, AZDoneLINK
Arnett Creek, AZDoneLINK

Example video for the Goldfields in which we fly along the path of the introductory tour:

Here is an example of one of the explanatory tutorial videos for ArcGIS:

Here is geology tour for the Salt River mapping project:

Here is longer geology tour for the Arnett Creek Spring Break mapping project: