
Tuesday, January 24, 2012
How the Earth Was Made - S01E01 San Andreas Fault (Documentary)
This is a cool San Andreas Fault documentary: http://watchdocumentary.com/watch/how-the-earth-was-made-s01e01-san-andreas-fault-video_202fae216.html. Lots of fun commentary by Ken Hudnut and others as well as nice footage along the San Andreas Fault especially in the Carrizo Plain.

Monday, November 21, 2011
Repeat photography shows the amazing damage and rebuilding after the March 2011 Japan earthquake and tsunami
This came floating along in the news feed in Facebook from Sue Owen, but seems so impressive it is worth a blog entry to capture it for a while:
http://blogs.sacbee.com/photos/2011/09/japan-marks-6-months-since-ear.html
Example:

This combo image, the initial destruction and progress of cleanup after the March 11, 2011 earthquake and tsunami is seen in Kesennuma, Miyagi prefecture, northern Japan. The top photo, taken March 13, shows a street covered by debris burnt by a fire. The middle photo, taken June 3, 2011 shows a partial clean-up of the same street, while the bottom photo taken Sept. 1, 2011 shows the area after the debris was removed. AP / Kyodo News
http://blogs.sacbee.com/photos/2011/09/japan-marks-6-months-since-ear.html
Example:
This combo image, the initial destruction and progress of cleanup after the March 11, 2011 earthquake and tsunami is seen in Kesennuma, Miyagi prefecture, northern Japan. The top photo, taken March 13, shows a street covered by debris burnt by a fire. The middle photo, taken June 3, 2011 shows a partial clean-up of the same street, while the bottom photo taken Sept. 1, 2011 shows the area after the debris was removed. AP / Kyodo News
Saturday, November 12, 2011
Updated pages for Kite and Balloon Aerial Photography
Thanks to the hard work of Tsurue Sato, we have a newly updated set of pages for Kite and Balloon Aerial Photography.
The new pages are connected from our Activetectonics research page: Low Altitude Aerial Photography.
I have an old blog posting on this topic as well: Balloon Photography Update. Note that the videos there and on the new pages are some of the most popular of my youtube videos because they were embedded on the Arizona Balloon Company homepage...
Here is a recent photo from CAMP SESE:

Sunday, August 28, 2011
USGS real time stream gages and Hurricane Irene effects of streamflow
The US Geological Survey real time stream gages are nicely reflecting the passage of high precipitation associated with Hurricane/Tropical storm/depression Irene: http://waterdata.usgs.gov/nwis/rt. The dots on the map show a general view of the state of flow and many black ones indicating high flow are in the northeast. (USGS Hurricane Irene resources).

If you click on a state (e.g., Pennsylvania) you can zoom in and then click on a particular gage to see the current flow state and its change with time (hydrograph) and build your own graphs, etc.
Here is the page for the Conestoga River at Lancaster, PA which at least right now (Sunday afternoon August 28, 2011) is on the steep rising limb of the hydrograph:

Location is here at this link
This is a critical USGS function that is under threat of severe reduction due to budget cuts.
I noticed that sometimes you have to reload a few times or just wait for the main map to appear. I don't know if they are getting heavy loads due to public interest or what is going on.
Hat tip to Michelle Cooke for this idea.
If you click on a state (e.g., Pennsylvania) you can zoom in and then click on a particular gage to see the current flow state and its change with time (hydrograph) and build your own graphs, etc.
Here is the page for the Conestoga River at Lancaster, PA which at least right now (Sunday afternoon August 28, 2011) is on the steep rising limb of the hydrograph:
Location is here at this link
This is a critical USGS function that is under threat of severe reduction due to budget cuts.
I noticed that sometimes you have to reload a few times or just wait for the main map to appear. I don't know if they are getting heavy loads due to public interest or what is going on.
Hat tip to Michelle Cooke for this idea.
Tuesday, August 23, 2011
M5.9 earthquake in Virginia, August 23, 2011
A moderate earthquake occurred today in Virginia (about 66 km NW of Richmond Virginia). It is listed as M5.9 by the USGS and was widely felt in the northeast and mid Atlantic region.
Here is the main USGS site on the event: http://earthquake.usgs.gov/earthquakes/recenteqsww/Quakes/usc0005ild.php. It looks like it was a NNE-trending reverse faulting mechanism (makes some sense with the geologic fabric and the compression directions in the eastern US).
UNAVCO Community Event Response to the 23 August 2011, Mw=5.8 Virginia Earthquake
Watch the event propagate through the USArray: USArray Ground Motion Visualization
Here is a nice NY Times article with information about the damage, a comparison of the felt effects from this event a similar-sized 2004 California earthquake (Parkfield), and a map of historic events in the eastern US (last big event was 5.4 in New Hampshire in 1940).

Watch the Did You Feel It page to see people report their sensation of the event and where.
Here is a short comment about the difference in attenuation between the east and west of North America.
It looks like it occurred within the Central Virginia Seismic zone which is an area that has produced small and moderate events in the past and is noted as a zone of somewhat increased earthquake hazard by the USGS. Note that there was an M4.5 in this area in 2003 (December 9). It was also widely felt.
Note that this was a tie for the largest earthquake recorded in Virginia: Giles County, Virginia 1897 05 31 18:58 UTC Magnitude 5.9
Here it is relative to historic seismicity. Click on link to see it broader with explanation (from USGS OFR 2006-1017):
 .
.

from http://www.virginiaplaces.org/geology but is derived from the USGS Open File report 2006-1017 below).
Here is a nice map and commentary from Virginia Tech on the Central Virginia Seismic zone.
Social media will be an important channel for people to communicate about this event:
Here are a few youtube links:
Earthquake Virginia Auto Repair Shop Collapses G&C
DC / Virginia Earthquake Aftermath
Wikipedia site is accumulating contributions: http://en.wikipedia.org/wiki/Virginia_Seismic_Zone
Here it is recorded at Arizona State University (thanks John West):

Here are a few other links I just came up with:
Major earthquakes in Virginia (from Virginia Division of Geology and Mineral Resources)
Earthquakes in Virginia and Vicinity 1774 - 2004 (USGS Open File Report 2006–1017) (big file and takes a while to download)
Virginia Earthquake Information from the USGS
IRIS Event plot suite
Tectonic Setting of the August 2011 Virginia Earthquake (Stein, et al.)
Latest update: 19:05 Arizona time August 29, 2011
Here is the main USGS site on the event: http://earthquake.usgs.gov/earthquakes/recenteqsww/Quakes/usc0005ild.php. It looks like it was a NNE-trending reverse faulting mechanism (makes some sense with the geologic fabric and the compression directions in the eastern US).
UNAVCO Community Event Response to the 23 August 2011, Mw=5.8 Virginia Earthquake
Watch the event propagate through the USArray: USArray Ground Motion Visualization
Here is a nice NY Times article with information about the damage, a comparison of the felt effects from this event a similar-sized 2004 California earthquake (Parkfield), and a map of historic events in the eastern US (last big event was 5.4 in New Hampshire in 1940).
Watch the Did You Feel It page to see people report their sensation of the event and where.
Here is a short comment about the difference in attenuation between the east and west of North America.
It looks like it occurred within the Central Virginia Seismic zone which is an area that has produced small and moderate events in the past and is noted as a zone of somewhat increased earthquake hazard by the USGS. Note that there was an M4.5 in this area in 2003 (December 9). It was also widely felt.
Note that this was a tie for the largest earthquake recorded in Virginia: Giles County, Virginia 1897 05 31 18:58 UTC Magnitude 5.9
Here it is relative to historic seismicity. Click on link to see it broader with explanation (from USGS OFR 2006-1017):
 .
.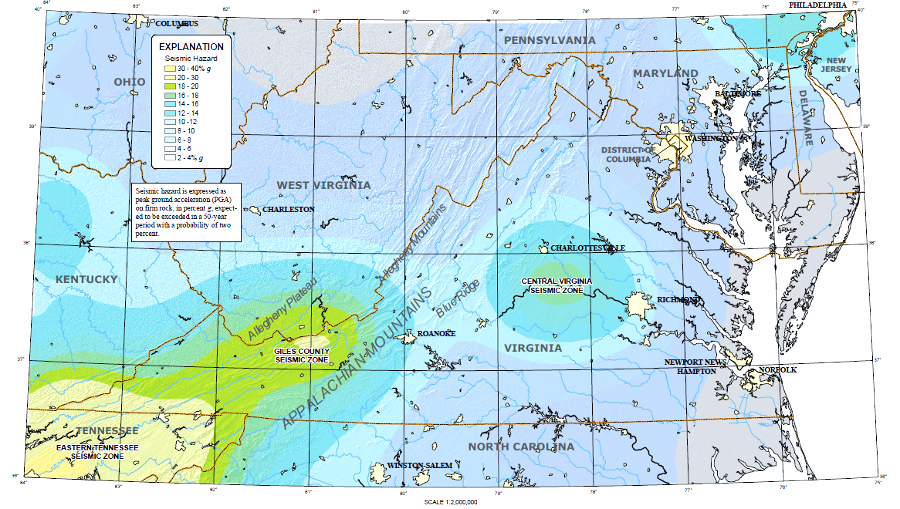
from http://www.virginiaplaces.org/geology but is derived from the USGS Open File report 2006-1017 below).
Here is a nice map and commentary from Virginia Tech on the Central Virginia Seismic zone.
Social media will be an important channel for people to communicate about this event:
Here are a few youtube links:
Earthquake Virginia Auto Repair Shop Collapses G&C
DC / Virginia Earthquake Aftermath
Wikipedia site is accumulating contributions: http://en.wikipedia.org/wiki/Virginia_Seismic_Zone
Here it is recorded at Arizona State University (thanks John West):

Here are a few other links I just came up with:
Major earthquakes in Virginia (from Virginia Division of Geology and Mineral Resources)
Earthquakes in Virginia and Vicinity 1774 - 2004 (USGS Open File Report 2006–1017) (big file and takes a while to download)
Virginia Earthquake Information from the USGS
IRIS Event plot suite
Tectonic Setting of the August 2011 Virginia Earthquake (Stein, et al.)
Latest update: 19:05 Arizona time August 29, 2011
Monday, August 8, 2011
Wallace Creek: New radiocarbon results and slip rate estimates of the San Andreas Fault in the Carrizo Plain
Our team along with Sinan Akciz and Lisa Grant-Ludwig from UC Irvine just finished a SCEC-supported project to re excavate a few of the trenches from the now famous work published as Sieh and Jahns, 1984 at Wallace Creek. While the slip rate of the San Andreas Fault has been well established at about 36 mm/yr from that work, it is only constrained by a few radiocarbon dates. With our experience working in the area and the enhanced capabilities of the W. M. Keck Carbon Cycle Accelerator Mass Spectrometry Laboratory at UC Irvine, we proposed that it was time to revisit the ages of the main offset channel at Wallace Creek.
View Larger Map
The effort was highlighted in a local newspaper: http://www.sanluisobispo.com/2011/08/07/1709285/quake-research-san-andreas-fault.html .
Here is our SCEC abstract that was just submitted (the title of this blog entry is the same):
Revisiting Wallace Creek: New radiocarbon results and slip rate estimates of the San Andreas Fault in the Carrizo Plain
S.O. Akciz, D.E. Haddad, W. Bohon, L. Delgadomendes, G. Marliyani, B. Salisbury, T. Sato, L. Grant Ludwig, J R. Arrowsmith
Sieh and Jahns (1984) determined the slip rate of the San Andreas fault (SAF) at Wallace Creek in the Carrizo Plain, and thereby provided an anchor for nearly all data-driven models of the southern San Andreas fault behavior. Their landmark study has been referenced hundreds of times and is a critical constraint in many related studies and in hazard estimates for the south-central SAF. Slip rate estimates at Wallace Creek (33.9±2.9 mm/yr) and at Van Matre Ranch site
(29.3-35.6 mm/yr; Noriega et al., 2006) agree well within measurement uncertainty, and with the 30–37 mm/yr velocity gradient across the SAF from decadal timescale geodetic measurements (Schmalzle, et al., 2006). Surprisingly, only a few detrital charcoal samples (9 samples at VMR, 8 samples at Wallace Creek) have been used to provide the absolute geochronological constraints. At a third site, Phelan Creeks, located ~ 2.5 km SE of Wallace Creek, 23 trenches were opened and over 400 charcoal samples were collected (Sims et al., unpublished data) to provide additional slip rate constraints, but the detailed study was never published.
New paleoseismologic investigations at the Bidart Fan site, ~5 km SE of Wallace Creek, indicate that southern SAF in the Carrizo Plain has apparently ruptured, on average, every 88 years (45-144 yr for individual intervals) between ~A.D. 1350 and 1857 (Akciz et al., 2010). B4 LiDAR (light detection and ranging) data analysis by Zielke et al. (2010) also found that only ~5.5 m of slip occurred along the SAF in the Carrizo Plain in 1857 and at least since ~A.D. 1400, and none of the earthquakes generated displacements larger than 5 meters (Grant Ludwig et al., 2010).
Slip per event and earthquake timing constraints can be tested against slip rate information to assess the steadiness of slip. Therefore, these new data and the geochronological limitations of the published slip-rate studies emphasize the need to improve, if not confirm, the existing slip-rate estimates by providing additional geochronological constraints. In August, 20111, we re-excavated T7 and T11 from Sieh and Jahns' study, photologged the trench walls (1:10) and collected a total of 30 new detrital charcoal samples from different stratigraphic layers from both of the trenches. Trench logs and radiocarbon results will be presented.
References:
Akciz, S.O., Grant Ludwig, L., and Arrowsmith, J R., 2009, Revised dates of large earthquakes along the Carrizo section of the San Andreas Fault, California, since A.D. 1310±30. Journal of Geophysical Research-Solid Earth, v. 114, B01313-6841.
Akciz, S.O., Grant Ludwig, L., Arrowsmith, J R., Zielke, O., 2011. Century-long average time intervals between earthquake ruptures of the San Andreas fault in the Carrizo Plain, California: Geology, v. 38, p. 787-790.
Grant Ludwig, L., Akciz, S.O., Noriega, G. R., Zielka, O., Arrowsmith, J R., 2010. Climate- Modulated Channel Incision and Rupture History of the San Andreas Fault in the Carrizo Plain: Science, 327, 5969, p. 1117-1119.
Sieh, K. E., 1977, Late Holocene displacement along the south-central reach of the San Andreas Fault, Ph.D. dissertation, Stanford University, Stanford, California, 219 pp.
Sieh, K.E., and Jahns, R.H., 1984, Holocene Activity of the San-Andreas Fault at Wallace Creek, California: Geological Society of America Bulletin, v. 95, p. 883-896.
Zielke, O., Arrowsmith, J R., Ludwig L G., Akciz, S.O., 2010. Slip in the 1857 and Earlier Large Earthquakes Along the Carrizo Plain, San Andreas Fault: Science, 327, 5969, p. 1119-1122.
 |
| Aerial view of open excavations (photograph by Wendy Bohon, ASU) |
View Larger Map
The effort was highlighted in a local newspaper: http://www.sanluisobispo.com/2011/08/07/1709285/quake-research-san-andreas-fault.html .
Here is our SCEC abstract that was just submitted (the title of this blog entry is the same):
Revisiting Wallace Creek: New radiocarbon results and slip rate estimates of the San Andreas Fault in the Carrizo Plain
S.O. Akciz, D.E. Haddad, W. Bohon, L. Delgadomendes, G. Marliyani, B. Salisbury, T. Sato, L. Grant Ludwig, J R. Arrowsmith
Sieh and Jahns (1984) determined the slip rate of the San Andreas fault (SAF) at Wallace Creek in the Carrizo Plain, and thereby provided an anchor for nearly all data-driven models of the southern San Andreas fault behavior. Their landmark study has been referenced hundreds of times and is a critical constraint in many related studies and in hazard estimates for the south-central SAF. Slip rate estimates at Wallace Creek (33.9±2.9 mm/yr) and at Van Matre Ranch site
(29.3-35.6 mm/yr; Noriega et al., 2006) agree well within measurement uncertainty, and with the 30–37 mm/yr velocity gradient across the SAF from decadal timescale geodetic measurements (Schmalzle, et al., 2006). Surprisingly, only a few detrital charcoal samples (9 samples at VMR, 8 samples at Wallace Creek) have been used to provide the absolute geochronological constraints. At a third site, Phelan Creeks, located ~ 2.5 km SE of Wallace Creek, 23 trenches were opened and over 400 charcoal samples were collected (Sims et al., unpublished data) to provide additional slip rate constraints, but the detailed study was never published.
New paleoseismologic investigations at the Bidart Fan site, ~5 km SE of Wallace Creek, indicate that southern SAF in the Carrizo Plain has apparently ruptured, on average, every 88 years (45-144 yr for individual intervals) between ~A.D. 1350 and 1857 (Akciz et al., 2010). B4 LiDAR (light detection and ranging) data analysis by Zielke et al. (2010) also found that only ~5.5 m of slip occurred along the SAF in the Carrizo Plain in 1857 and at least since ~A.D. 1400, and none of the earthquakes generated displacements larger than 5 meters (Grant Ludwig et al., 2010).
Slip per event and earthquake timing constraints can be tested against slip rate information to assess the steadiness of slip. Therefore, these new data and the geochronological limitations of the published slip-rate studies emphasize the need to improve, if not confirm, the existing slip-rate estimates by providing additional geochronological constraints. In August, 20111, we re-excavated T7 and T11 from Sieh and Jahns' study, photologged the trench walls (1:10) and collected a total of 30 new detrital charcoal samples from different stratigraphic layers from both of the trenches. Trench logs and radiocarbon results will be presented.
References:
Akciz, S.O., Grant Ludwig, L., and Arrowsmith, J R., 2009, Revised dates of large earthquakes along the Carrizo section of the San Andreas Fault, California, since A.D. 1310±30. Journal of Geophysical Research-Solid Earth, v. 114, B01313-6841.
Akciz, S.O., Grant Ludwig, L., Arrowsmith, J R., Zielke, O., 2011. Century-long average time intervals between earthquake ruptures of the San Andreas fault in the Carrizo Plain, California: Geology, v. 38, p. 787-790.
Grant Ludwig, L., Akciz, S.O., Noriega, G. R., Zielka, O., Arrowsmith, J R., 2010. Climate- Modulated Channel Incision and Rupture History of the San Andreas Fault in the Carrizo Plain: Science, 327, 5969, p. 1117-1119.
Sieh, K. E., 1977, Late Holocene displacement along the south-central reach of the San Andreas Fault, Ph.D. dissertation, Stanford University, Stanford, California, 219 pp.
Sieh, K.E., and Jahns, R.H., 1984, Holocene Activity of the San-Andreas Fault at Wallace Creek, California: Geological Society of America Bulletin, v. 95, p. 883-896.
Zielke, O., Arrowsmith, J R., Ludwig L G., Akciz, S.O., 2010. Slip in the 1857 and Earlier Large Earthquakes Along the Carrizo Plain, San Andreas Fault: Science, 327, 5969, p. 1119-1122.
Wednesday, July 20, 2011
EarthScope is the #1 Most Epic Project on Popular Science Website!

It is very cool that EarthScope has been selected as the #1 most epic science project at Popular Science Magazine/Website. They have an article in the August 2011 issue entitled: Big Science: The Universe's Ten Most Epic Projects. It is impressive to have that rating against some other big and exciting science projects, including the Large Hadron Collider and the International Space Station. They used some quantitative ratings and also some qualitative ones such as: What's in it for me? Wow factor, and Scientific Utility on all of which it received a 10. I think that the sense of EarthScope's practicality and its cost to size (variably measured) ratio help boost it. The write up is nice and generally gets the high points given its brevity.
This kind of coverage is really helpful for a program such as EarthScope in terms of visibility. It is the only earth science activity on the list (there is Neptune--ocean science observatory). We can put a lot of energy into outreach, but the readership of something like PopSci will simply dwarf anything we might do...
Since May, we (Matt Fouch, Ed Garnero, Steve Semken, Wendy Taylor, and I) have been leading the EarthScope National Office and I have been the Chair of the EarthScope Steering Committee, so this is very good news and due to the efforts of the prior ESNO staff at Oregon State University.
Subscribe to:
Posts (Atom)